
Overview
The studio environment allows for the creation of multiple draft forecasts; each containing different adjustments, or with time periods that overlap. Any draft forecast can be used in production.
This page describes the forecast creation process.
Note that only users with the WFM_SCHEDULER role assigned are able to add new forecasts. Read more about Workforce Management Roles.
Creating a Forecast
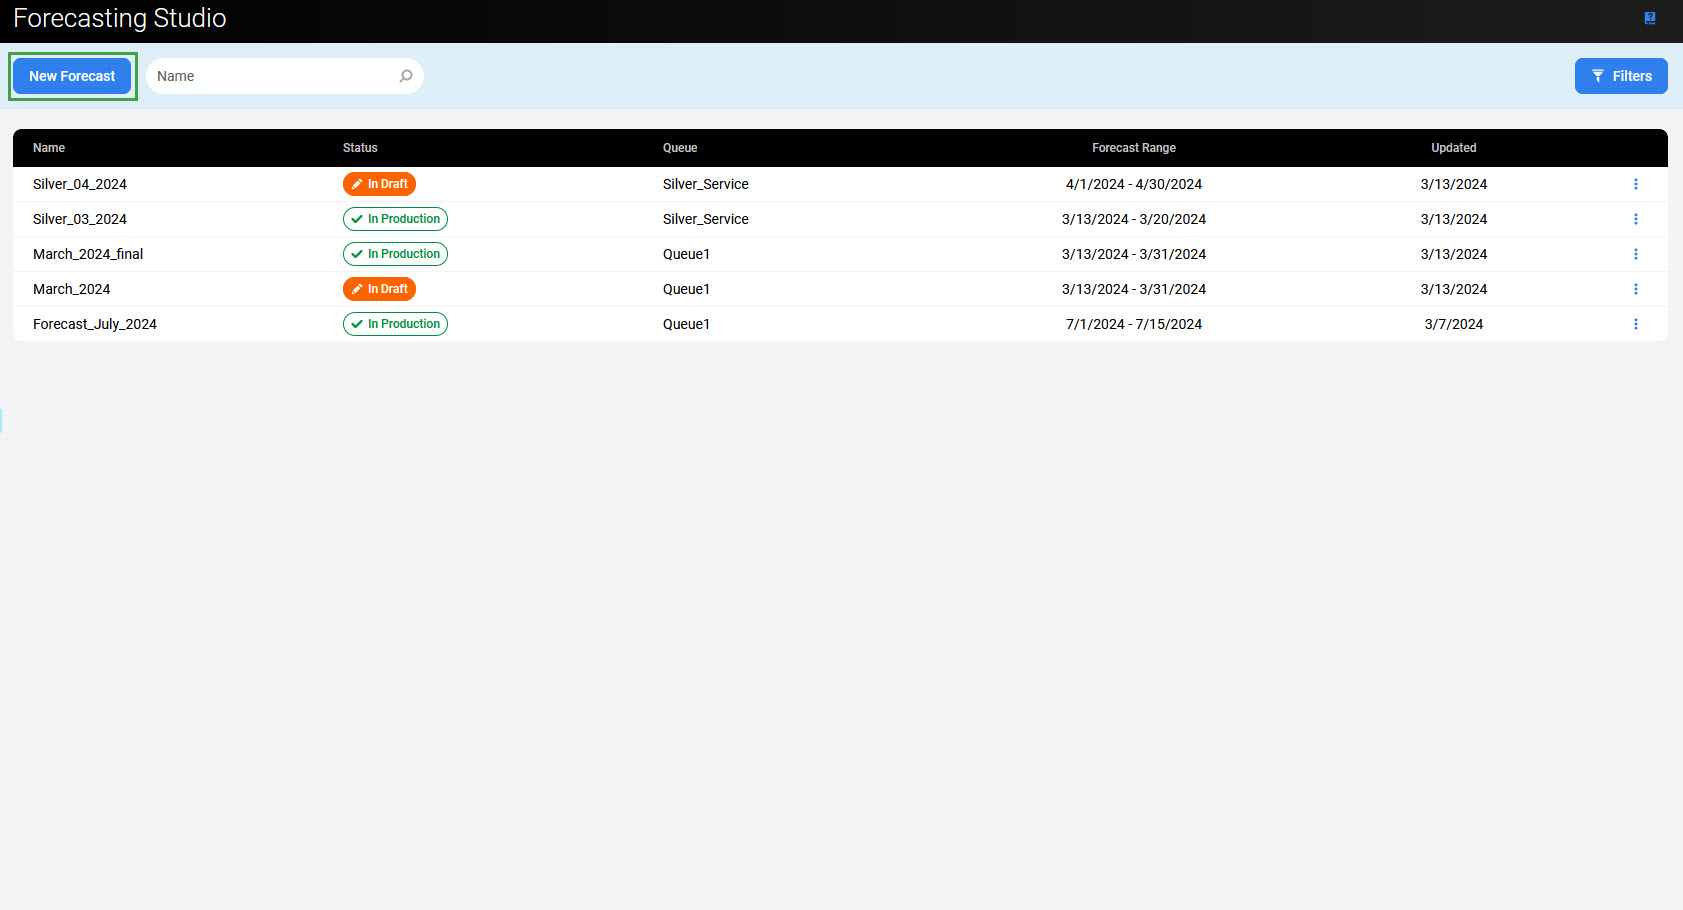
To add a new draft forecast, click on the New forecast button.
The Create New Forecast wizard will open.
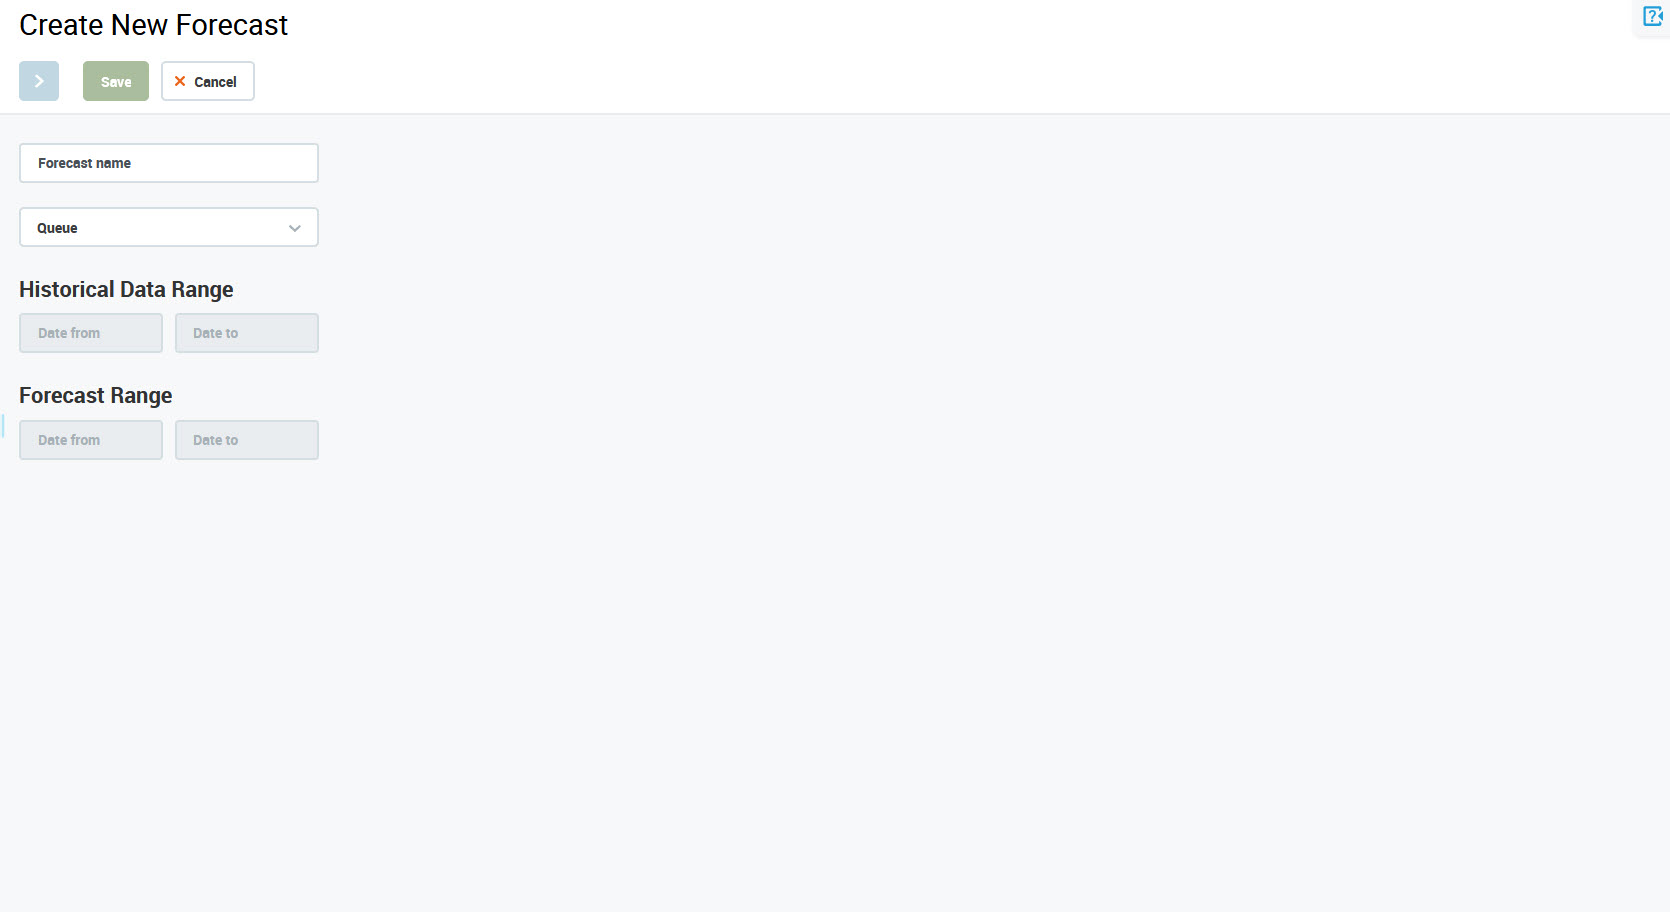
Fill in all required fields to complete the first step:
-
Forecast name – name of the new forecast
-
Queue – queue for which the forecast will be created (select from the drop-down menu)
-
Historical Data Range: Date from/Date to – time range of the historical data used for the new forecast (cannot be shorter than two weeks, only full weeks can be selected)
-
Forecast Range: Date from/Date to – time range of the new forecast
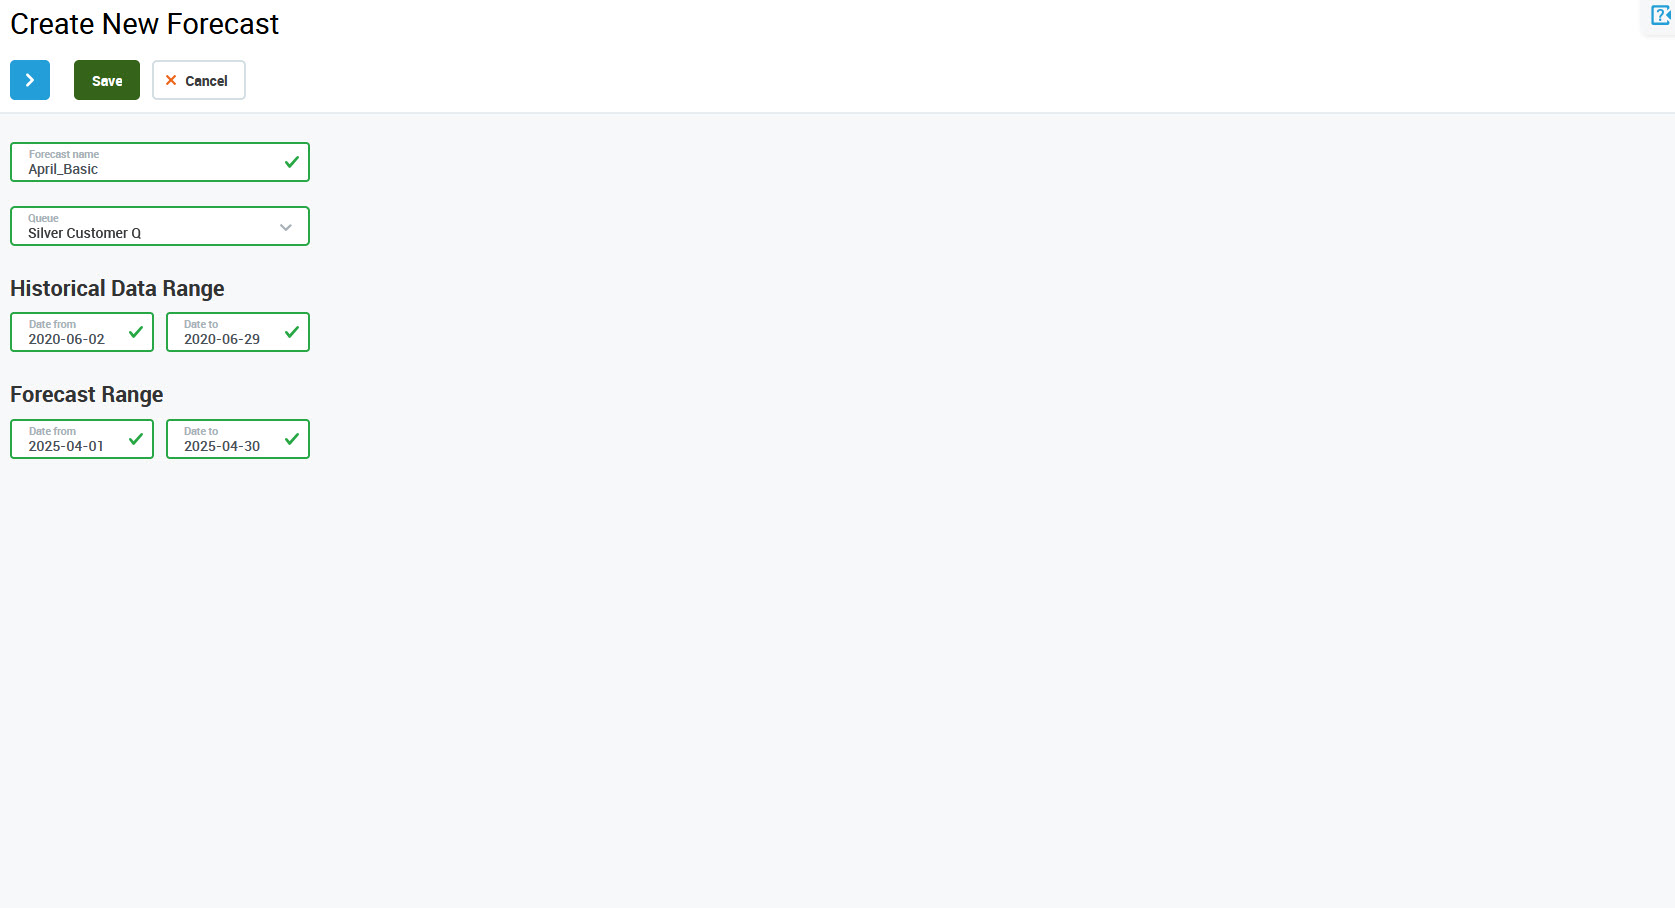
If the type of the selected queue is 'Chat', an additional field is available:
-
Number of concurrent chats – Number of chats that each person in this queue can handle concurrently (default value is 1)
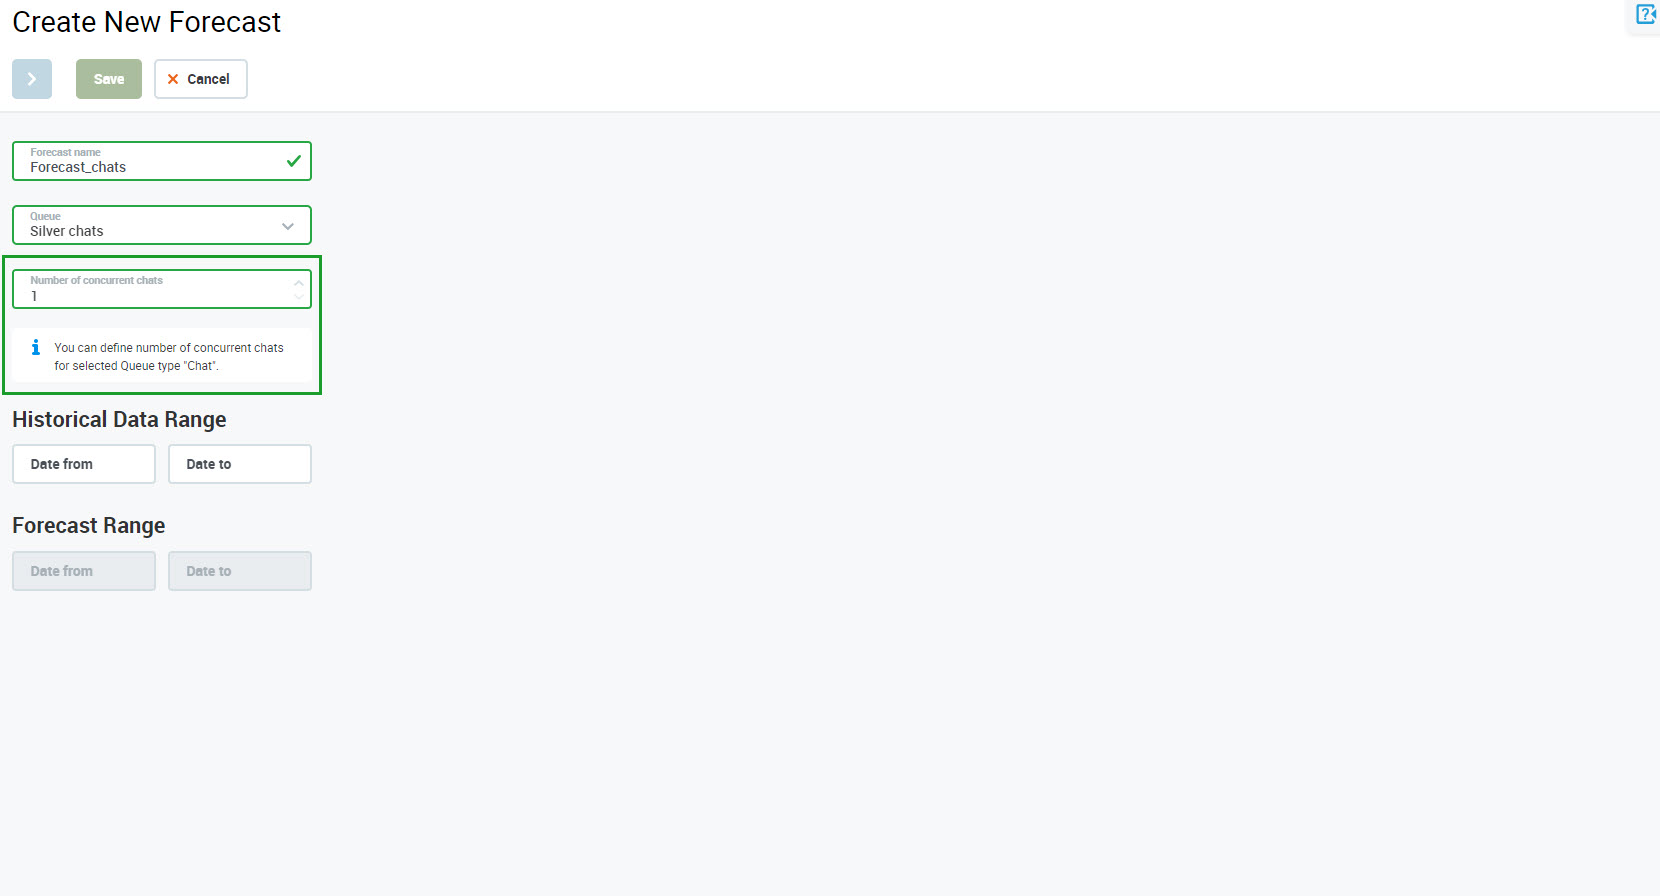
If the Historical Data Range fields are not active (greyed out), it means that there is no historical data available for the selected queue. Ensure that historical data were imported or select a different queue.
Note the following parameters:
Number of concurrent chats
The default number of concurrent chats that each person in the queue can handle is one. This means that each person can handle only one chat at any moment. If this value is changed to two (or any other number), it indicates that each person can handle two (or more) chats simultaneously. As a result, the Forecasted Staffing Requirements are recalculated and the number of people required is divided by two (or the number defined).
Historical Data Range
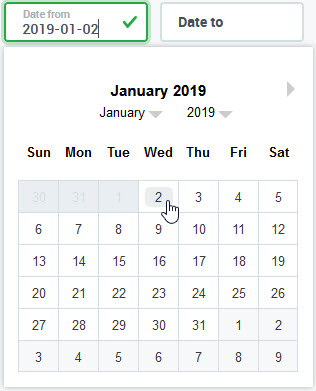
To configure the Historical Data Range, click on the Date from field to expand the calendar. Click on a day to select it:
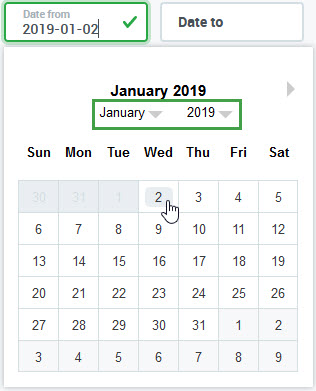
To quickly jump to a specific month or year, use drop-down menus.
Then, click on the Date to field to expand the second calendar. Only full weeks can be selected:
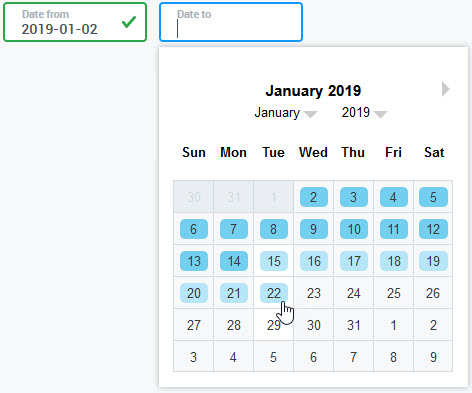
Note that the selected period of historical data cannot be shorter than two weeks! Due to this limitation, the calendar will only display options that ensure that the selection is two weeks or longer in length. Click on a day to select it, the whole range will be marked with blue.
Date selection is based on the time zone of the queue for which the forecast is created.
Example: Uploaded historical data covers the period from the 1st of January 2019 till the 1st of February 2019. When a new forecast is created the following limits apply:
-
Only days from the 1st to the 18th of January are available to be selected as a Date from. If a later date were selected, the whole period would be shorter than two weeks. The system does not permit this.
-
If the 18th of January (the last possible day) is selected as a Date from, then the 1st of February is the only available Date to (all earlier days would result in the period being shorter than two weeks).
Forecast Range
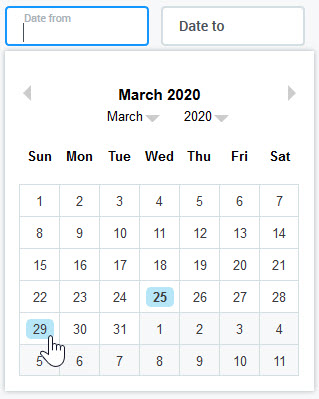
To configure the Forecast Range, click on the Date from field to expand the calendar. The period needs to start on the current day or later (Date from cannot be in the past). Click on a day to select it:
Then, click on the Date to field to expand the second calendar and select a day. The Forecast Range can be as short or as long as needed.
To create an efficient forecast follow these forecasting tips:
-
ensure that at least two weeks of historical data have been imported to the application (the system will not allow the creation of a forecast without this data)
-
reliable forecasts are created based on historical data that includes a range of between a few weeks and a few months
-
it is not recommended to create a forecast based on a historical data range that includes data from more than one year
-
it is not recommended to create a forecast for a period of time far in the future, the most accurate forecasts are created for the upcoming few months
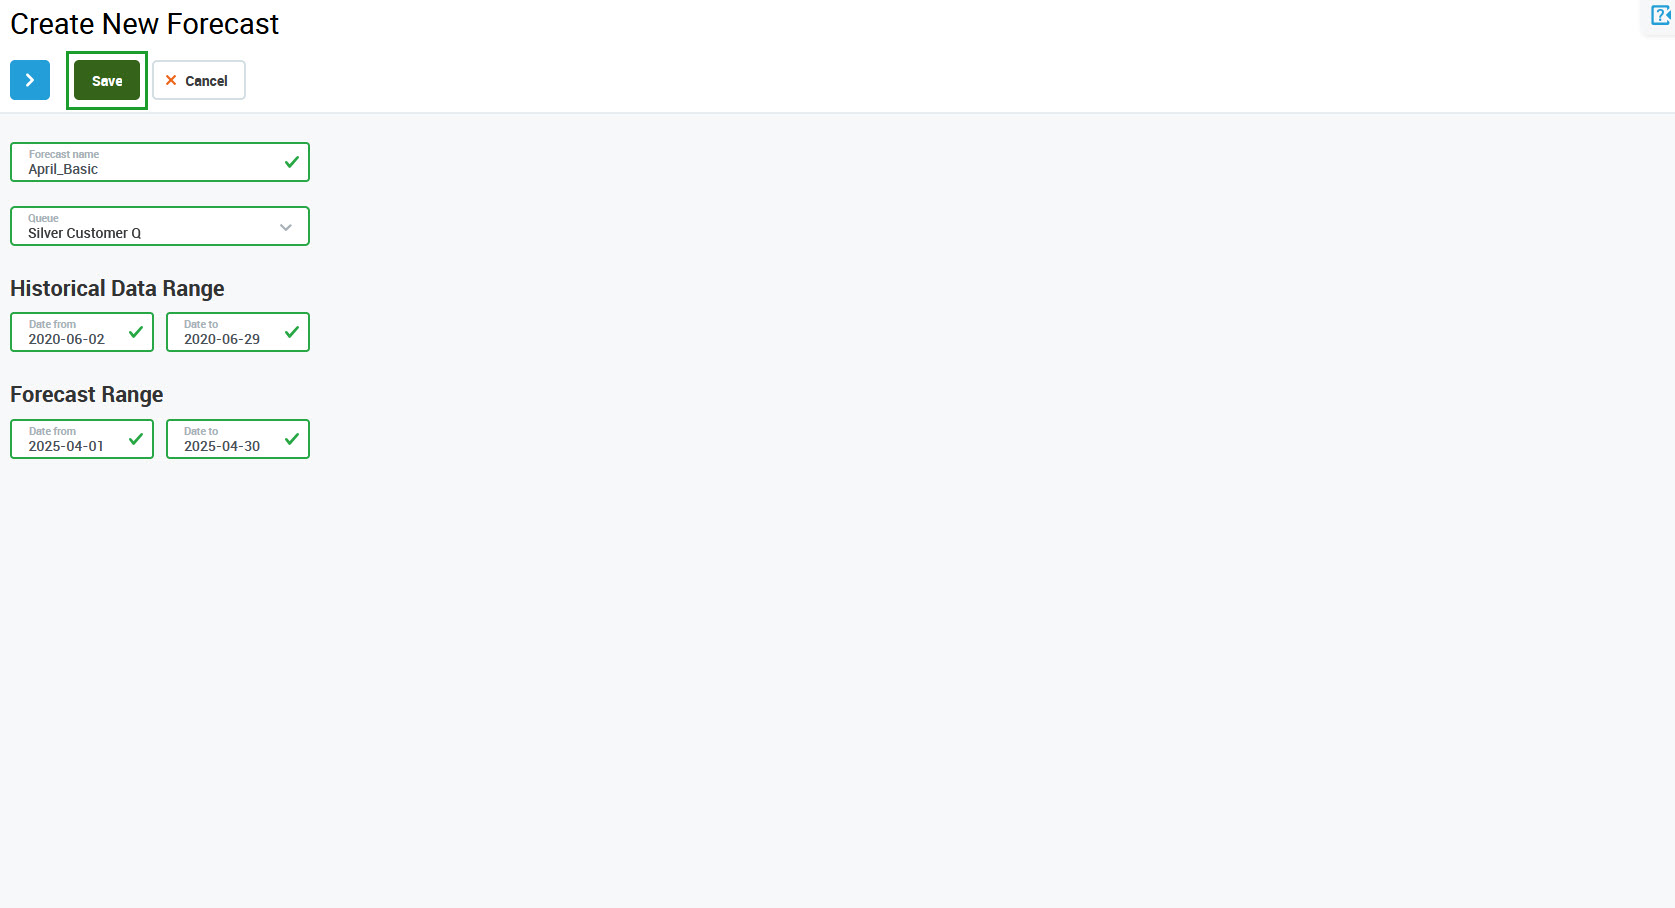
Click Save to create a forecast without having to proceed to the second step. In this case, a default value of shrinkage (10%) is applied to the forecast.
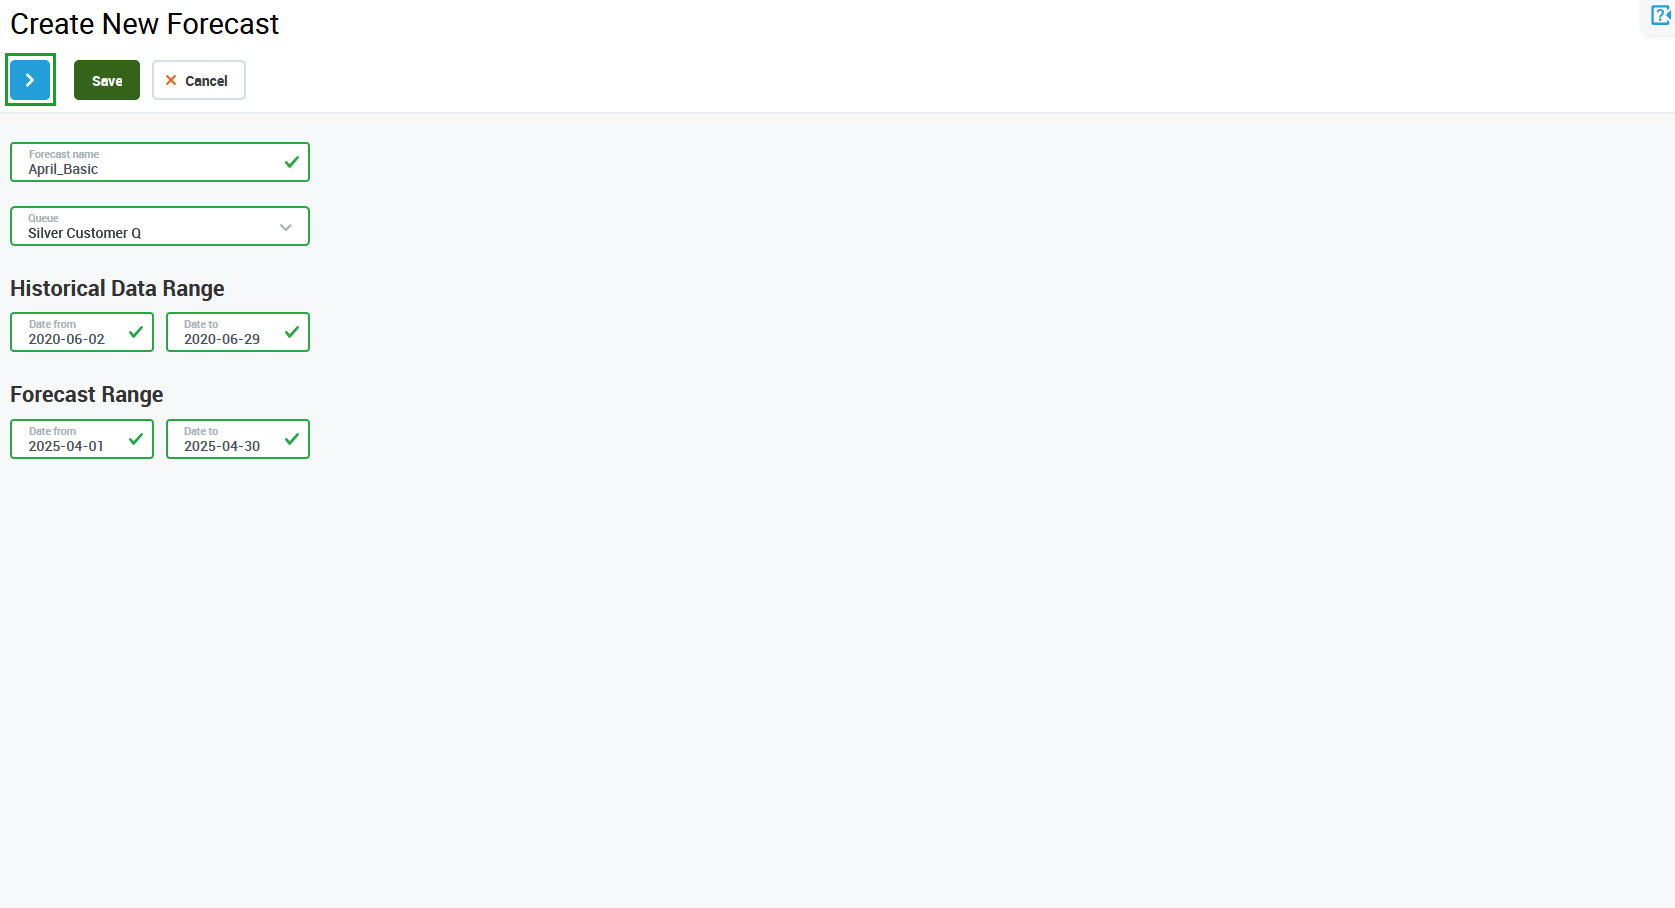
Alternatively, click the Next step button to proceed to the second step.
The second screen of the Create New Forecast wizard will open.
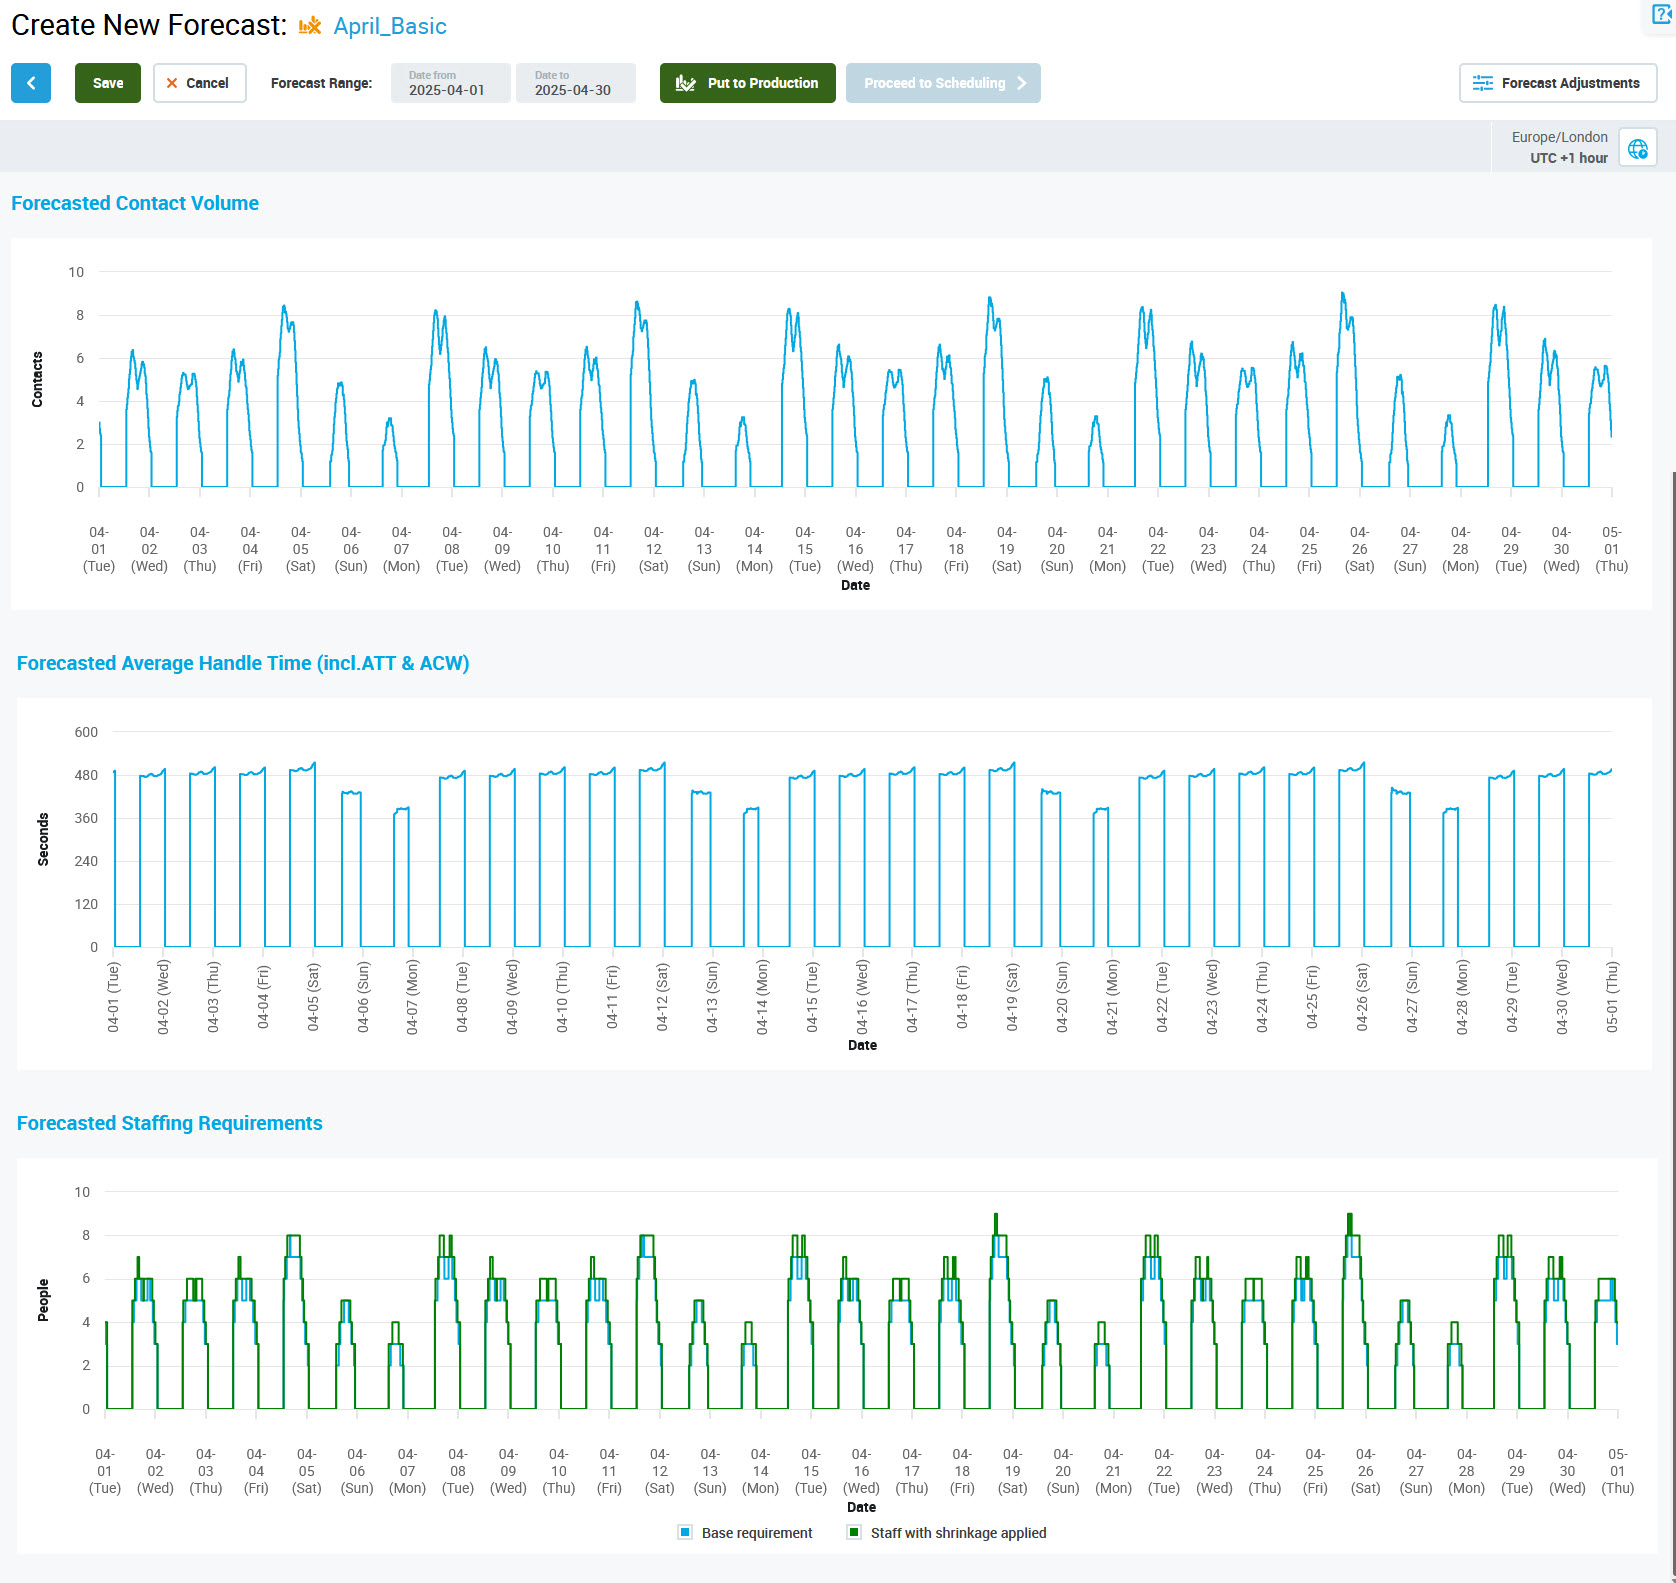
The screen contains charts calculated based on the data selected in the first step:
-
Forecasted Contact Volume – forecast of the number of incoming calls
-
Forecasted Average Handle Time (incl. ACW & ATT) – forecast of the average handling time of a call
-
Forecasted Staffing Requirements – forecast for the number of people needed to handle the predicted workload, including the Service Level, and with shrinkage (green line) or without shrinkage (blue line) applied
The forecast's name is displayed in the top left corner, and the In Draft icon indicates that it is still a draft.

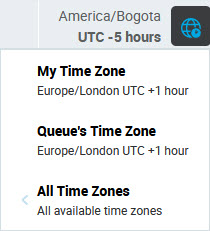
The time zone for which the forecast is displayed can be found in the top right corner of the screen. By default, the time zone of the queue is used.
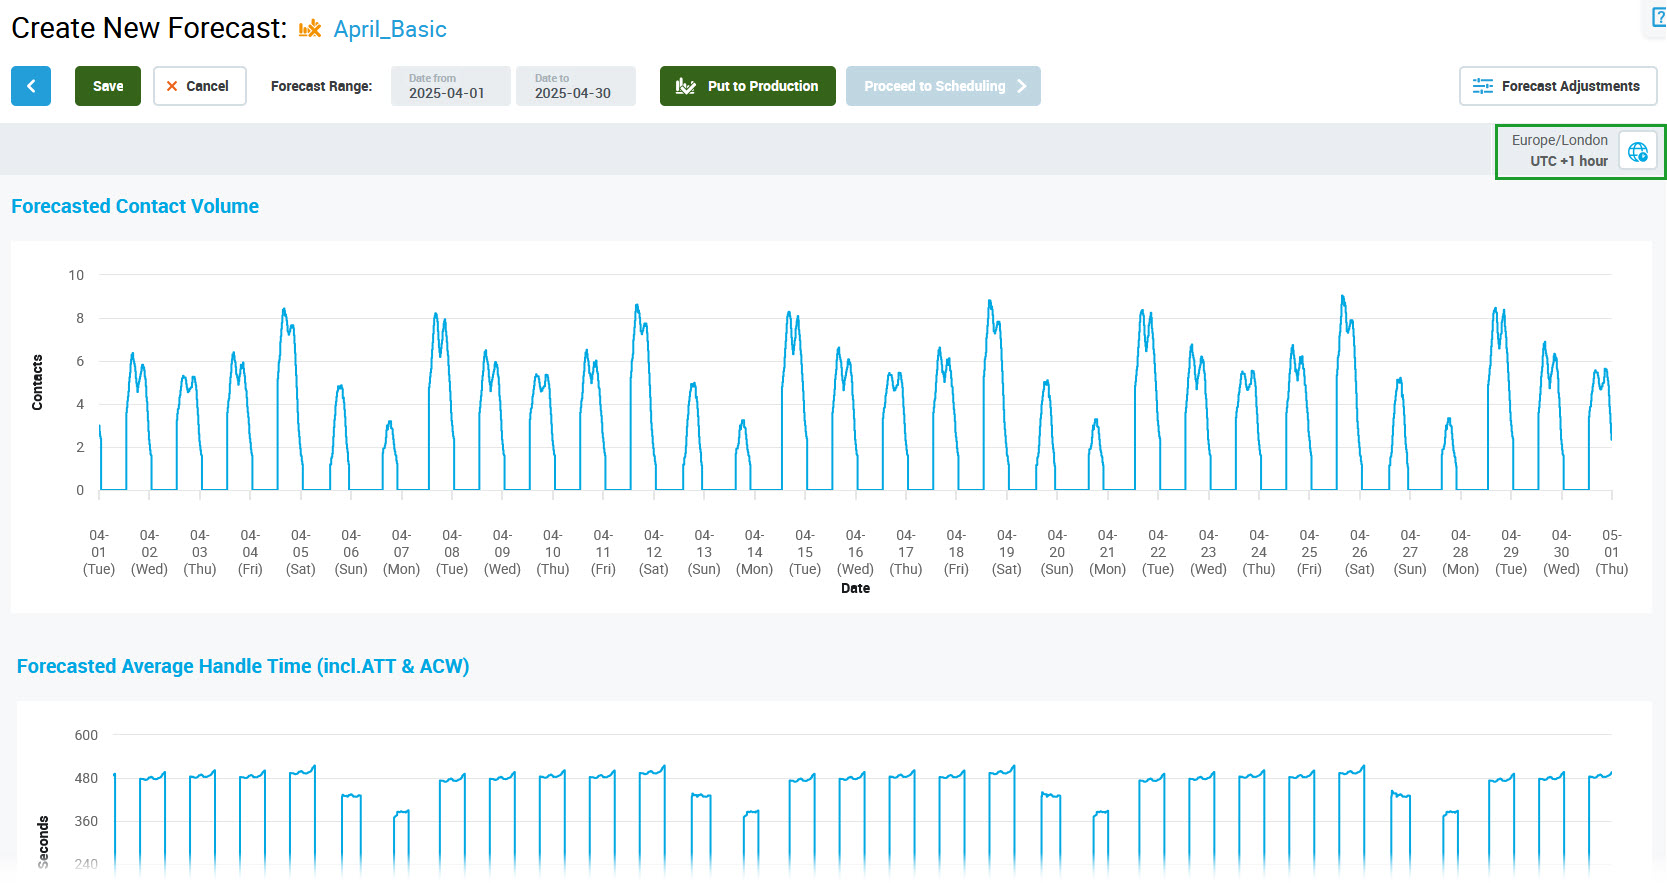
Click the time zone icon to select another time zone from the drop-down menu. The possible options are:
-
My Time Zone – time zone that the user browsing the forecast has set in User Management
-
Queue's Time Zone – time zone set for the queue for which the forecast was created
-
All Time Zones – any other time zone (selectable from a drop-down menu)
The forecast will be automatically displayed in the newly selected time zone.
Note that if a time zone of a queue is changed, all draft forecasts created for this queue will be recalculated (the beginning and end of the forecast may change) and displayed in a new time zone. Production forecasts will not be recalculated, but they will be displayed in the new time zone.
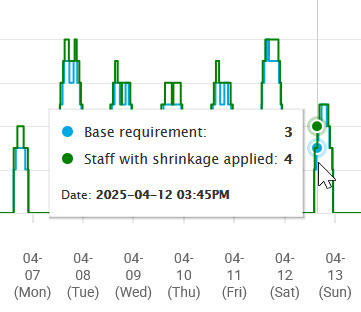
Hover a mouse pointer over the chart to view details. A tooltip will display, showing the exact value for the selected point in time. The time interval is the same as the time interval of historical data based on which the forecast was created (for manual import, this value needs to be set). For voice queues, it is usually 15 minutes.
Adding Adjustments
The Forecast Adjustments pane allows for modifying the Contact Volume or AHT values calculated based on historical data. By default, the raw calculated values of Contact Volume and AHT are displayed (100%), but they can be changed for selected date and time range, in 15-minutes intervals. Also, shrinkage can be modified. Different adjustments can be added for different days.
To modify the forecast, click the Forecast Adjustments button in the top right corner of the screen. The Forecast Adjustments pane will display.
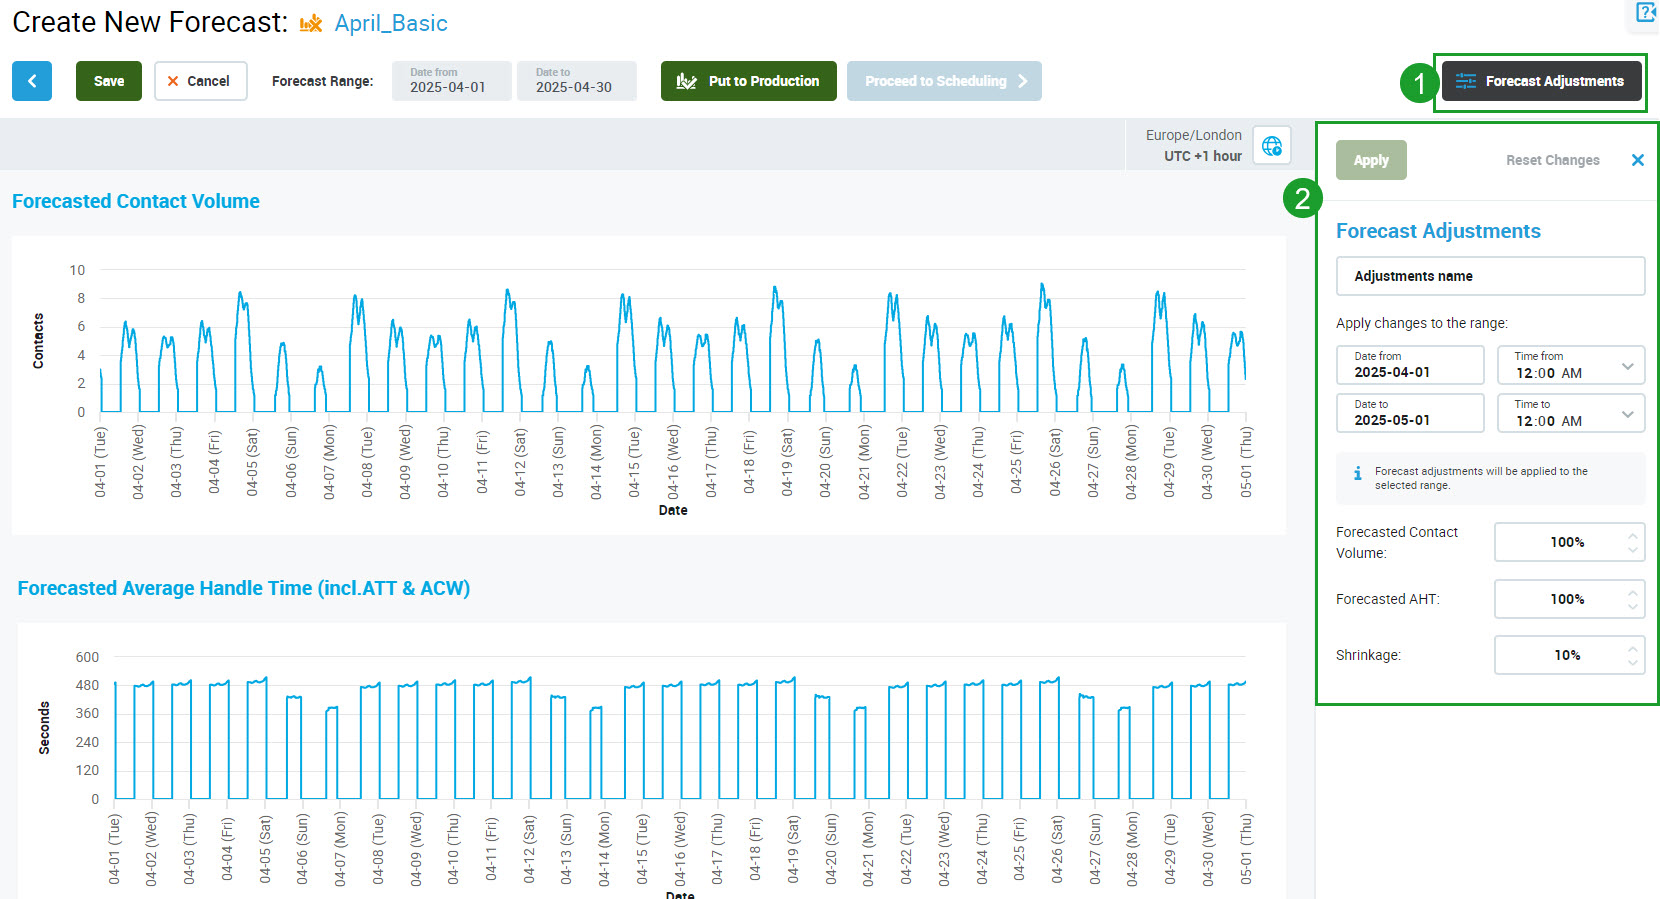
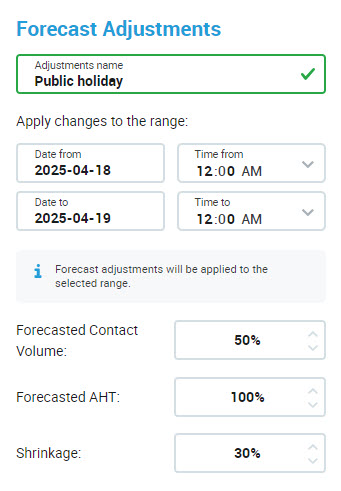
Configure the values:
-
Adjustment name – the name of the adjustment
-
Date range to which the adjustment will apply (by default the whole range of the forecast is selected)
-
Time range to which the adjustment will apply (the lowest selectable interval is 15 minutes)
-
Forecasted Contact Volume – the percentage of the calculated Contact Volume value with should be used in the forecast in the defined date range (default value is 100%)
-
Forecasted AHT – the percentage of the calculated AHT value that should be used in the forecast in the defined date range (default value is 100%)
-
Shrinkage – the value of the shrinkage (default value is 10%)
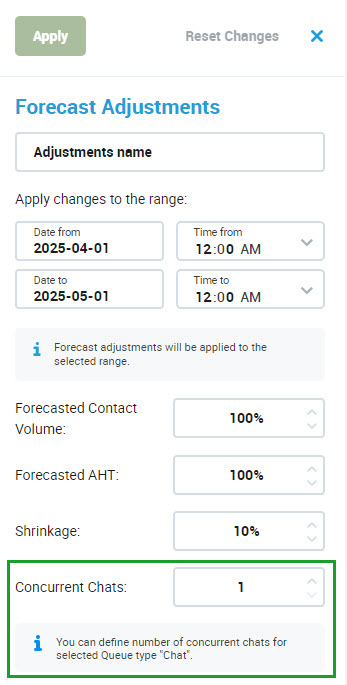
If the type of the queue is Chat, an additional field is available:
-
Concurrent Chats – Number of chats that each person in this queue can handle concurrently (default value is 1)
Click Apply to apply the adjustment or Reset Changes to clear the form.
Example:
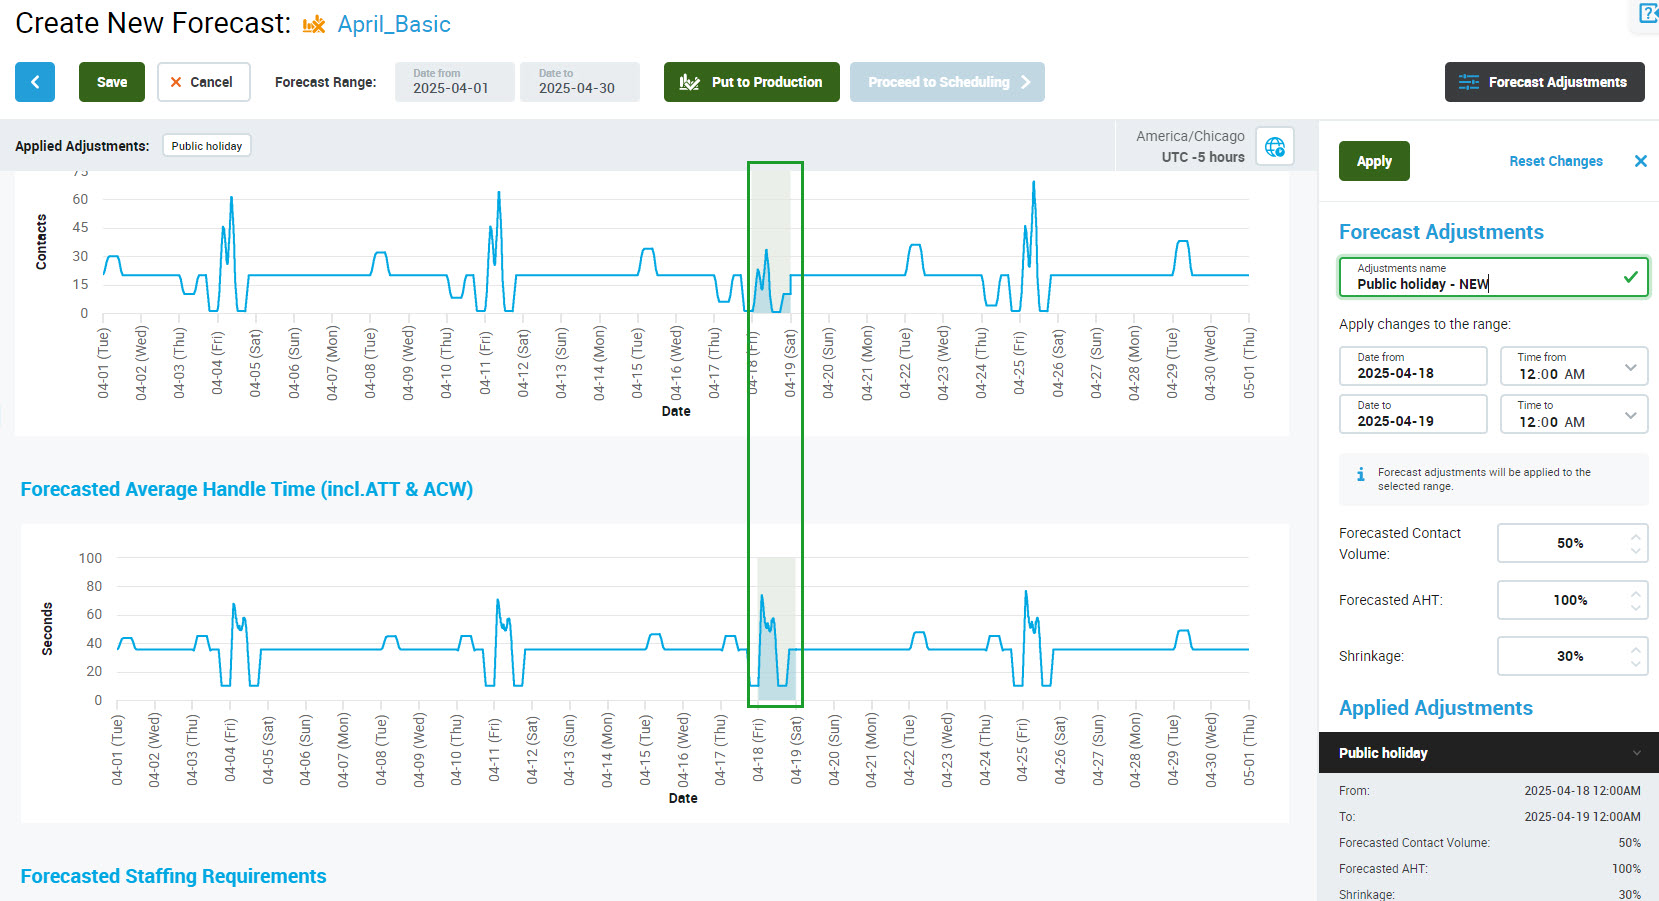
A forecast has been created for April (based on historical data), however, an analyst who is preparing the forecast knows that there will be a public holiday on the 18th of April. Based on this she assumes that the Contact Volume will be lower. She is going to add a new adjustment, modifying the Forecasted Contact Volume to 50%, and Shrinkage to 30%.
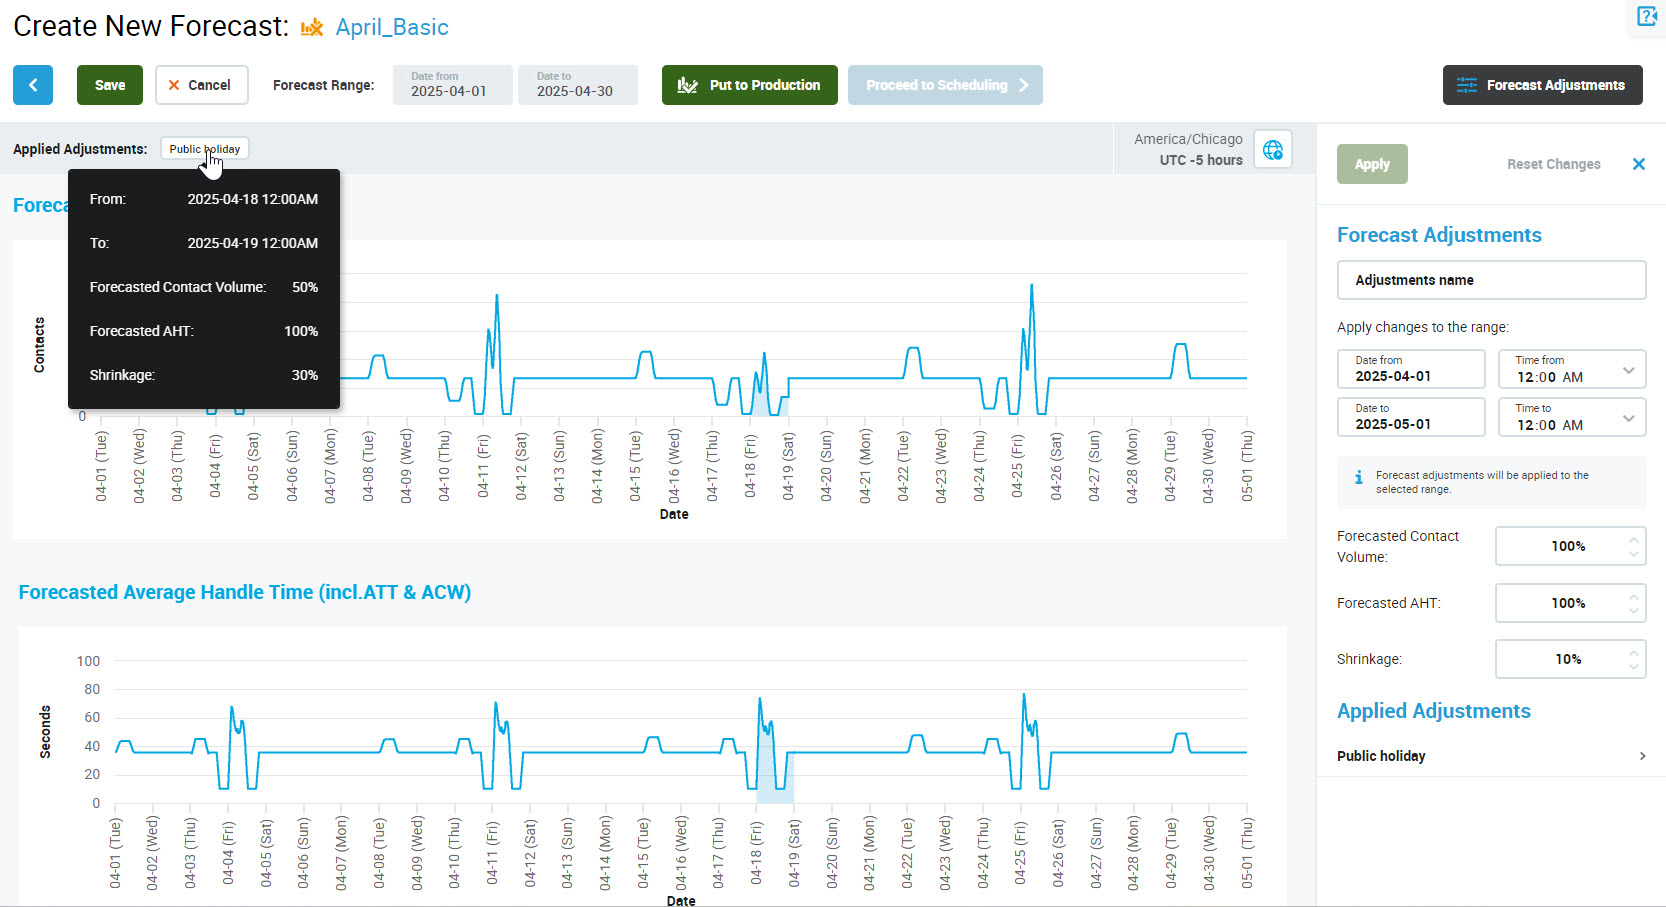
Applied adjustments are visible in the top left corner of the screen. Hover the mouse pointer over them to view details.
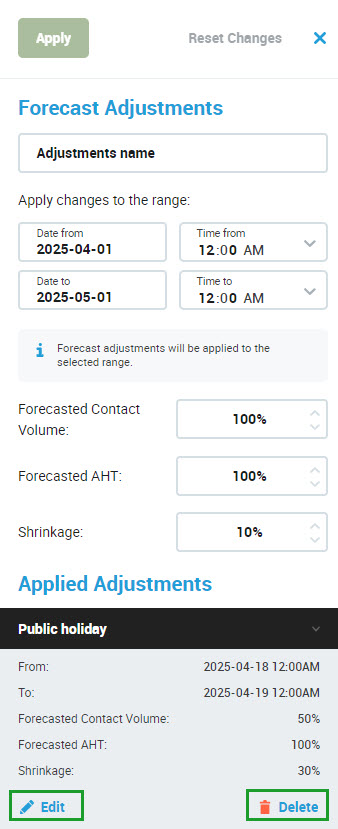
Additionally, applied adjustments are visible in the Forecast Adjustments pane. Click on the adjustment's name to expand it. Use the Edit button to modify it or the Delete button to remove it.
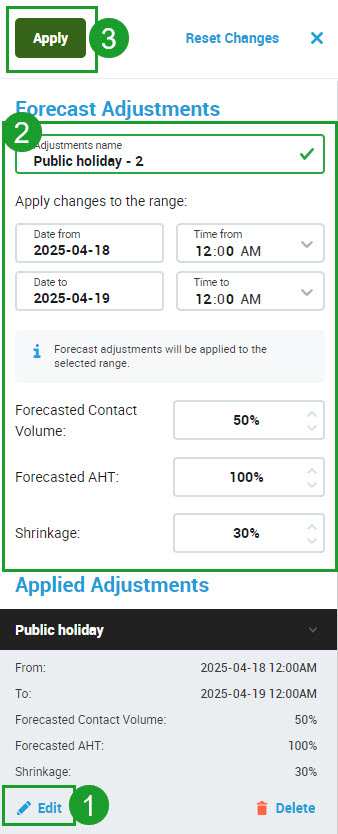
After clicking the Edit button, the adjustment details can be modified within the pane. Click Apply to apply changes.
The changes applied by the adjustment are automatically reflected on the chart. Note that the time range of the currently edited adjustment is marked with a grey background.
It is not possible to add more than one adjustment for the same selected date and time range. If there is an overlap, a notification will display:
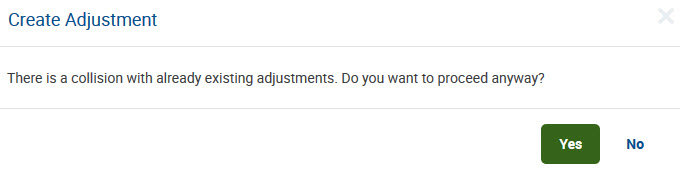
Click No to modify the time range of the new adjustment. Click Yes to save the new adjustment and overwrite the previous one.
If there is a need to amend some new corrections to a particular period of existing adjustment, define a new adjustment containing all of the required corrections. It will overwrite that period of the original adjustment.
Example
A user has created an adjustment A increasing call volumes to 120% from Monday to Sunday. Then, the user wants to increase shrinkage on Saturday and Sunday to 40% but has already submitted an adjustment A. If the user adds an adjustment B increasing shrinkage only, increasing call volumes on Saturday and Sunday will not be applied (will be overwritten with this second correction).
To solve this issue, the user can create an adjustment B for Saturday and Sunday that contains both corrections: increases call volumes to 120% and also increases shrinkage to 40%.
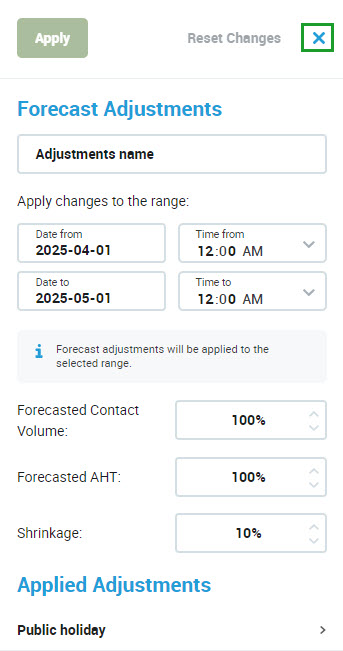
The Forecast Adjustment pane is expanded by default. To hide it, click the Forecast Adjustments button or the Close button.
Saving a Forecast
Click the Save button to save the forecast. Additionally, the second step of the wizard allows for the forecast to be put to production. In order to do this, click the Put to Production button. If the forecast isn't saved yet, it will be first saved and then automatically put to production. More information about working with the production forecast can be found on the page Working with Production Forecast.
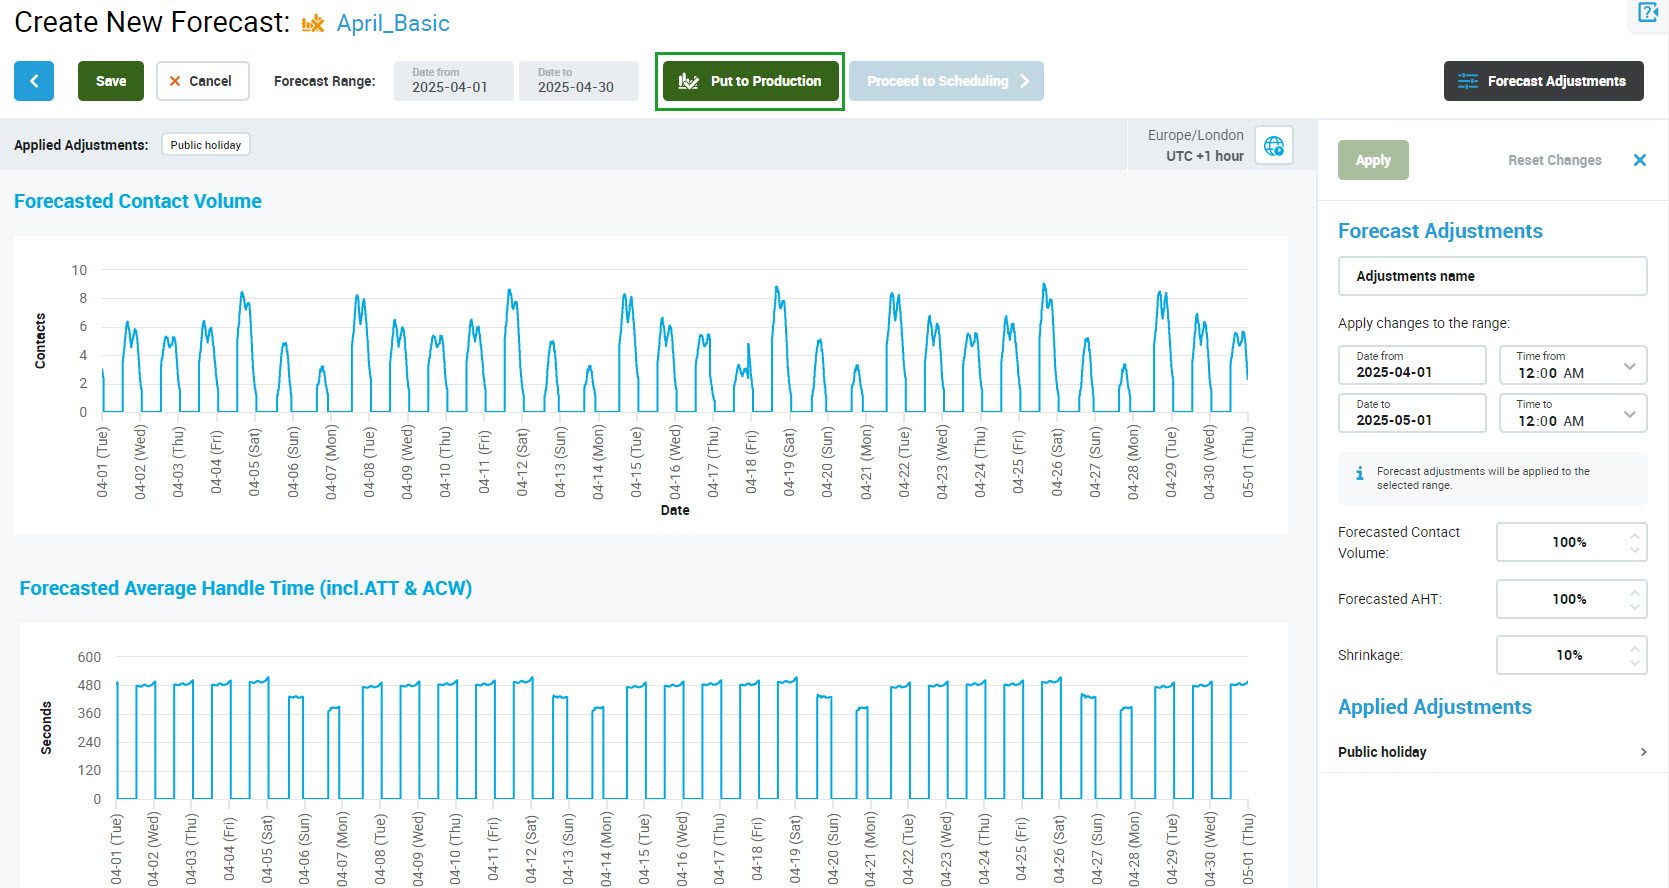
If the forecast needs to be modified, click the Previous step button to return. Otherwise, click Proceed to Scheduling to continue to the Scheduling Studio or Put to Draft to remove the current forecast from production.
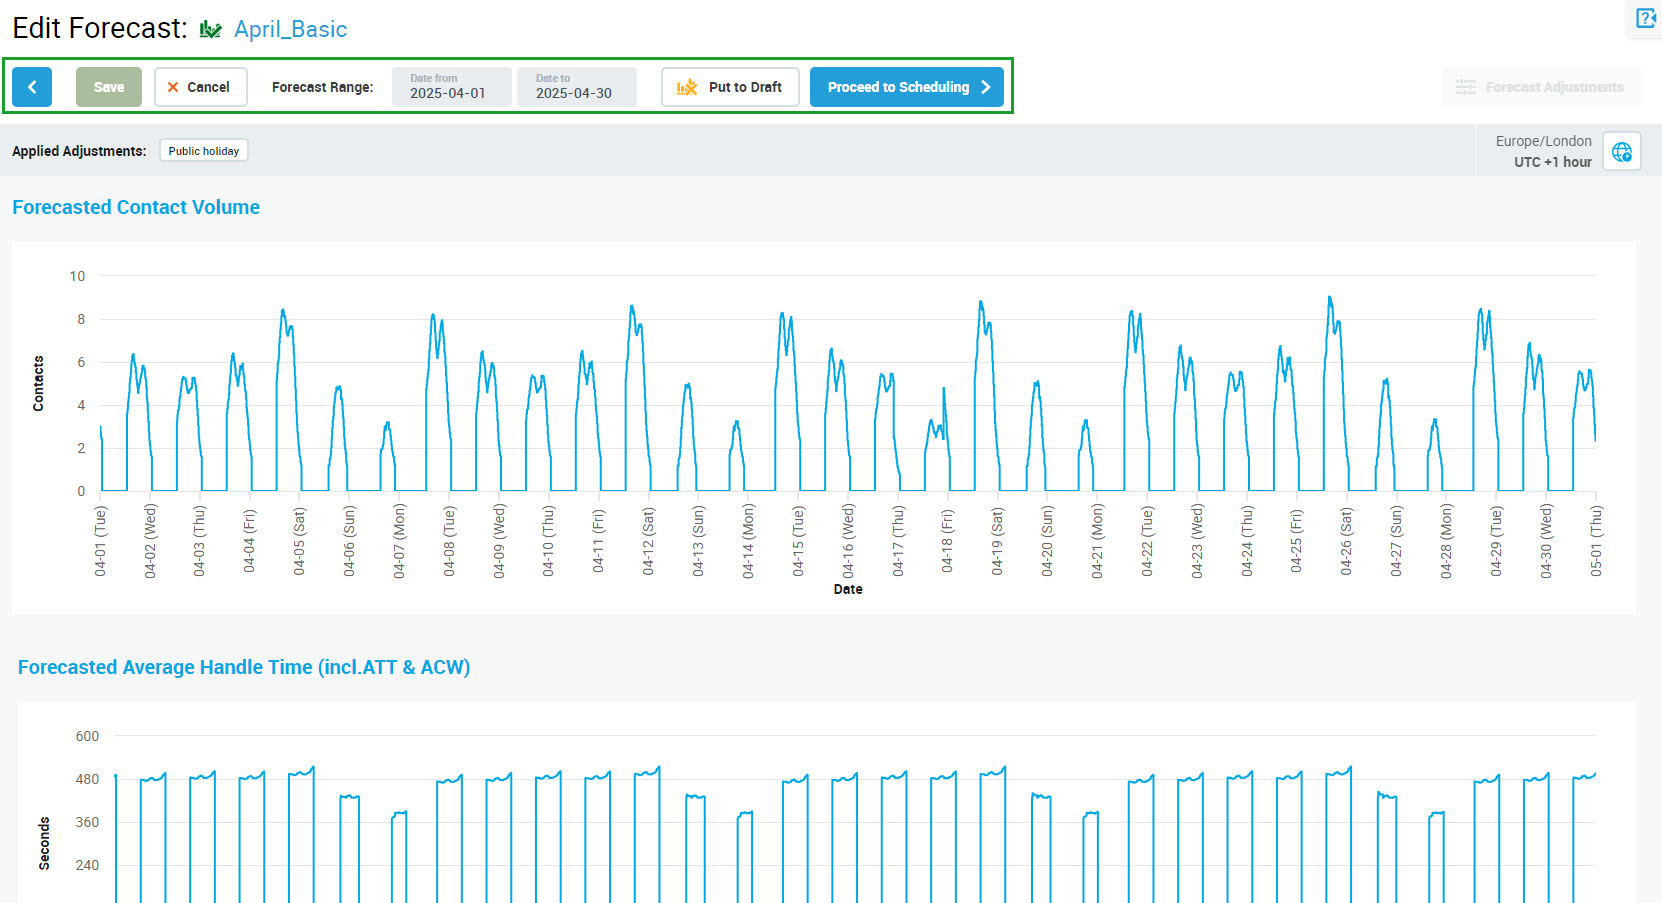
Click Cancel to leave without saving changes.
Note that if adjustments were already applied to the forecast, and then you go back to the first step and reduce the date range of the forecast to be shorter than the date range of any of these adjustments, a warning message will display:
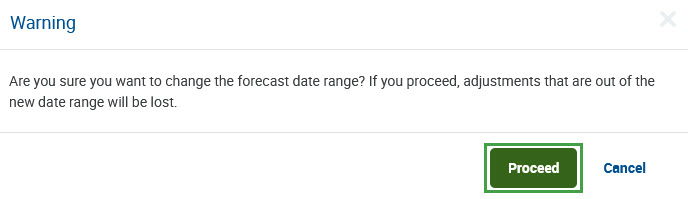
Click Proceed to change the date range of the forecast and recalculate adjustments by reducing their date range. Adjustments that are out of the new date range will be lost. Alternatively, click Cancel to abandon changes.
A dialog window will indicate if there are unsaved changes. Click Save and leave to save changes before leaving the Create New Forecast page or Leave to abandon changes. Click Cancel to close the dialog window and continue working with the forecast.

Note that after clicking the Save Forecast button you will remain on the Create New Forecast screen. Use the navigation tree on the left to go back to the Forecasting Studio screen or other screens.