The AI Insights Report provides a comprehensive summary of key metrics and emerging trends that have been identified through advanced generative AI analysis techniques. This report is designed to offer valuable insights by focusing specifically on monitoring the quality of customer interactions and tracking how these interactions evolve over time. It achieves this by utilizing AI-generated ratings, analyzing sentiment, and detecting relevant topics within the conversations, thereby enabling a deeper understanding of customer engagement dynamics.
The following role is necessary in order to see the report in the menu:
-
ANALYTICS_AI_INSIGHTS_VIEW.
The following roles grant permissions to see the report:
-
ANALYTICS_AGENT– allows to see the report, including own data only -
ANALYTICS_SUPERVISOR/ANALYTICS_MANAGER– allows viewing data for all agents the user supervises (the user has the “Can Manage” option enabled on the team the agent belongs to, and the agent has that team set as “Main” in User Management). -
ANALYTICS_EXECUTIVE– allows viewing data for all agents.
Interactive Guide
Displaying AI Insights Report
To display the AI Insights report, expand the Reports module within the navigation tree and click AI Insights. The AI Insights screen will display. By default, a report for the last 14 days is generated, including data for all agents that the current user supervises.
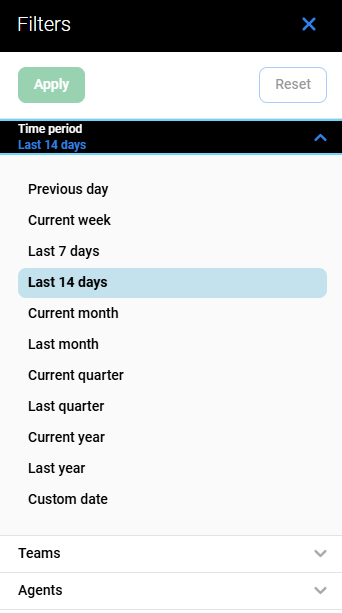
To modify the report, click the Filters button in the top right corner and use the Filters pane.
Click the tabs to expand them and display the following filters:
-
Time period – displays only data within the selected time range (if not selected, data from the last 14 days are displayed)
-
Teams – displays only data for people who are members of the selected teams or their subteams (if none are selected, displays data for all teams)
-
Agents – displays only data for the selected people (if none are selected, displays data for all people).
Click Apply to apply the filters and generate a report.
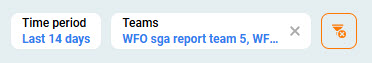
Active filters appear at the top of the screen. They can be removed individually or all at once by clicking the Remove icon on the right.
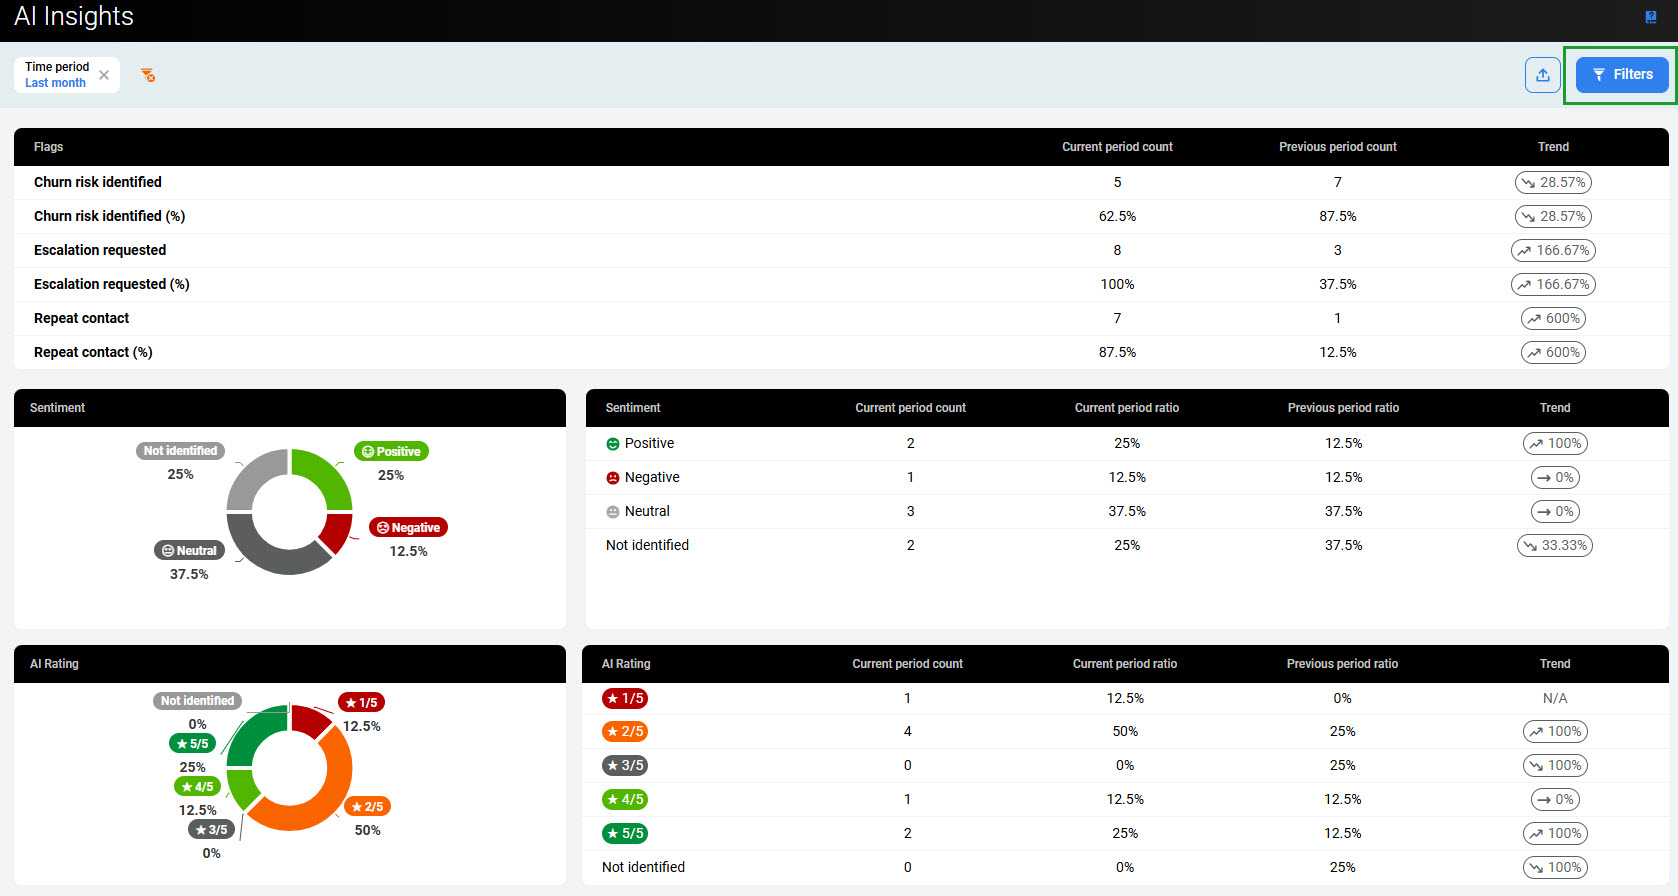
Reading the Report
The report contains the following sections:
-
Flags – occurrences of specific events detected in conversations in the current and previous time periods
-
Sentiment – occurrences of different sentiments (positive/negative/neutral) in conversations in the current and previous time periods
-
AI Rating – occurrences of different AI Ratings (1/2/3/4/5) in conversations in the current and previous time periods
-
Topics - TOP 10 – list of the ten most popular topics detected in conversations.
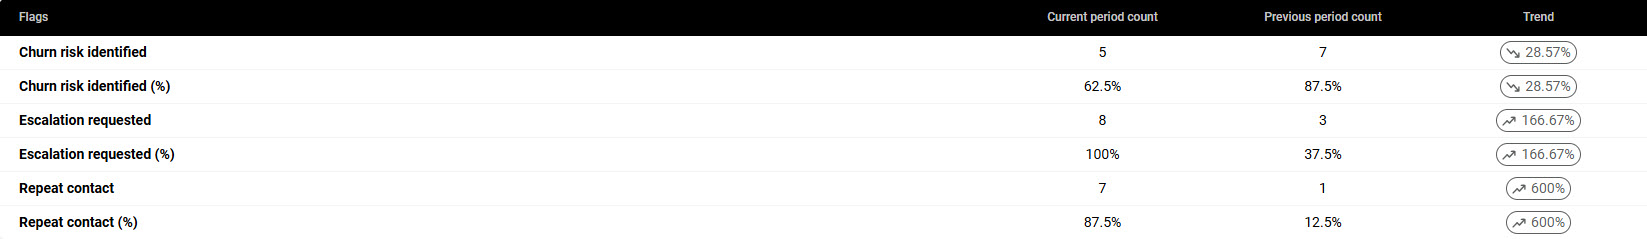
Flags
Eleveo's AI Flagging technology proactively analyses every conversation and flags conversations in which the following event(s) were detected:
-
Churn risk – customer’s dissatisfaction or intent to leave
-
Escalation – customer expresses the need to speak to a supervisor or move up the chain of command
-
Repeat contact – customers express frustration about having to reach out multiple times for the same concern.
The table in the Flags section contains the following counters:
-
Churn risk identified – in how many conversations was a churn risk identified
-
Churn risk identified (%) – in what percentage of conversations was a churn risk identified
-
Escalation requested – in how many conversations was an escalation requested
-
Escalation requested (%) – in what percentage of conversations was an escalation requested
-
Repeat contact – in how many conversations was a repeat contact detected (customers express frustration about having to reach out multiple times for the same concern) detected
-
Repeat contact (%) – in what percentage of conversations was a repeat contact detected?
For each of the counters above, the table contains the values:
-
Current period count – number of conversations with the flag for the selected time period
-
Previous period count – number of conversations with the flag for the previous time period
-
Trend – percentage representation of a trend and whether it is rising or falling, when comparing the current period ratio and the previous period ratio
Previous period
A previous time period is a period of the same lenght as a current period and ending just before the current period starts. For example:
-
current period 15.08 - 25.08, previous period: 4.08 - 14.08,
-
current period 1.03-31.03, previous period: 28.01-28.02.
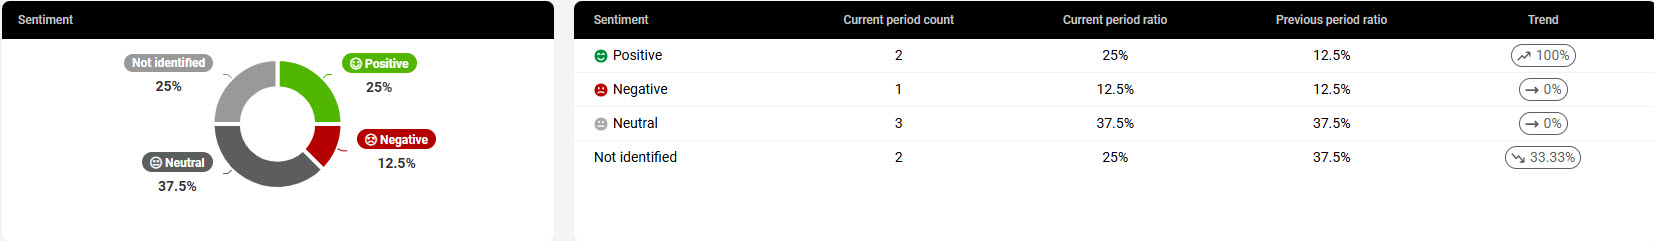
Sentiment
The overall Sentiment of a conversation is determined by Generative AI based on its analysis of the conversation transcription. The sentiment evaluation is text-based (not derived from acoustic signals or voice tone) and is classified as Positive, Neutral, or Negative.
The table in the Sentiment section contains the following values for all detected sentiments:
-
Current period count – number of conversations with this sentiment detected in the current time period
-
Current period ratio – percentage of conversations with this sentiment detected in the current time period
-
Previous period ratio – percentage of conversations with this sentiment detected in the previous time period
-
Trend – percentage representation of a trend and whether it is rising or falling, when comparing the current period ratio and the previous period ratio
The graph on the left shows sentiment in the current period, the table provides additional detail.
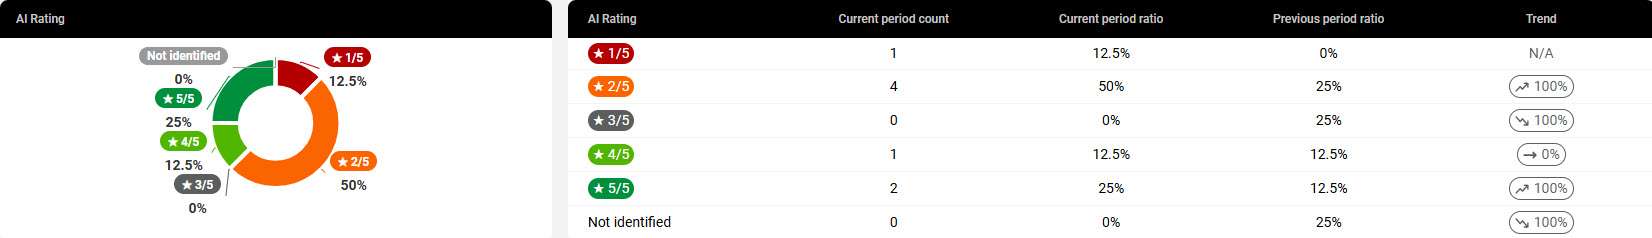
AI Rating
All conversations are automatically rated by Generative AI, with scores from 1 (the lowest) to 5 (the highest). The AI Rating section contains the following values for all ratings (1/2/3/4/5/Not identified):
-
Current period count – number of conversations with this rating detected in the current time period
-
Current period ratio – percentage of conversations with this rating detected in the current time period
-
Previous period ratio – percentage of conversations with this rating detected in the previous time period
-
Trend – percentage representation of a trend and whether it is rising or falling, when comparing the current period ratio and the previous period ratio
The graph on the right shows ratings in the current period.
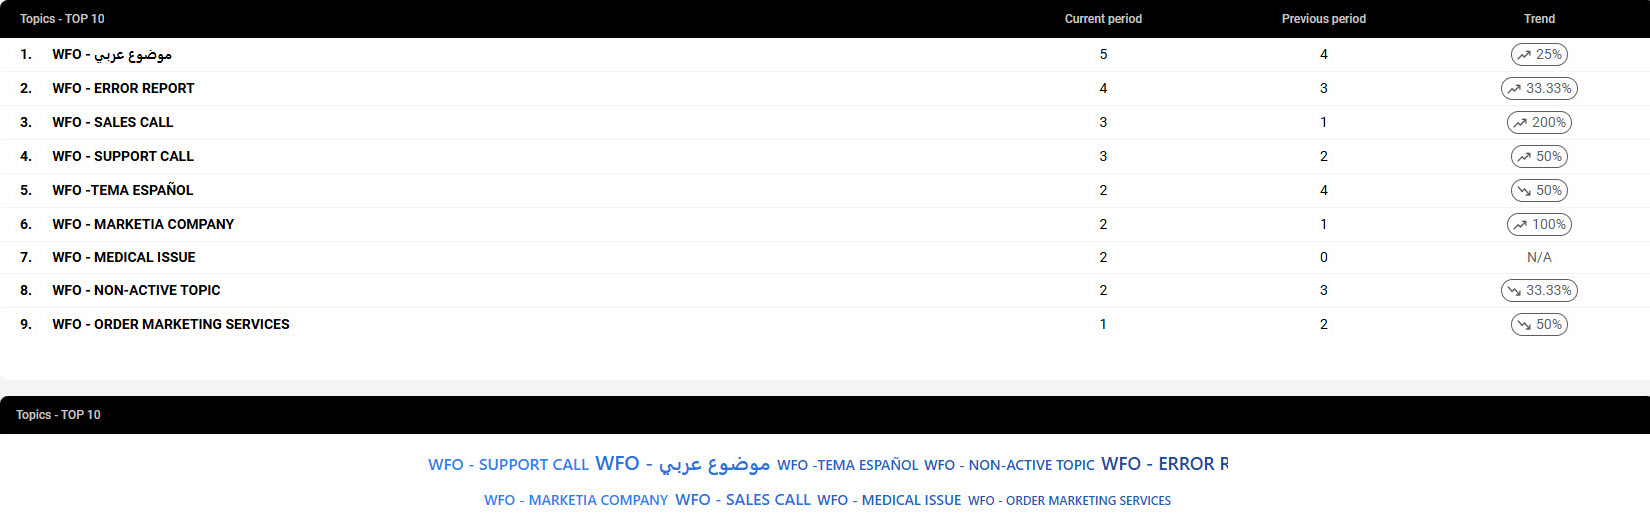
Topics - TOP 10
The Topics - TOP 10 section lists the top 10 most popular topics in conversations and their counters:
-
Current period count – number of conversations in which this topic was detected for the selected time period
-
Previous period count – number of conversations in which this topic was detected for the previous time period
-
Trend – percentage representation of a trend and whether it is rising or falling, when comparing the current period ratio and the previous period ratio
Exporting Data
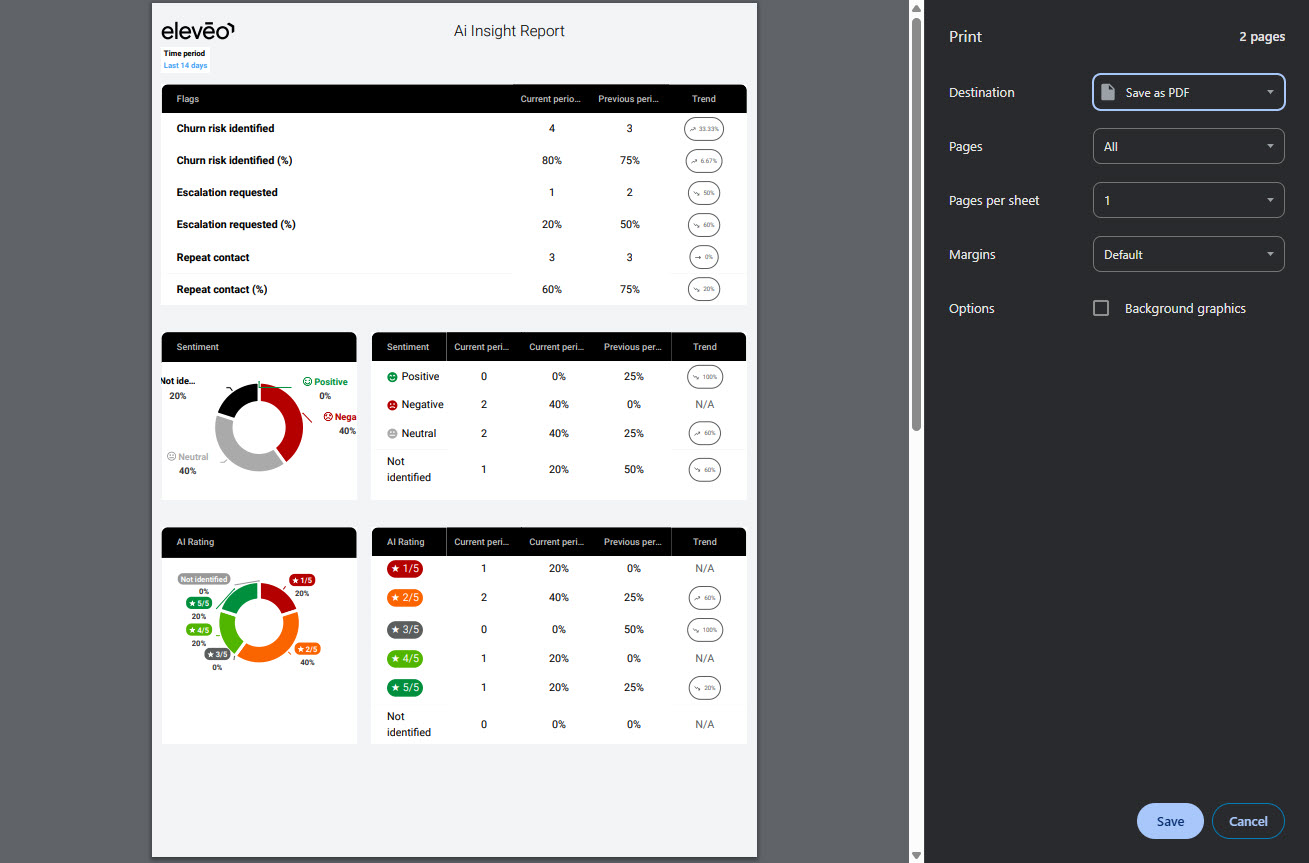
To export the report, click the Export button.

Select Export PDF. The current view of the report can then be saved as a PDF.