The Schedule Adherence report allows supervisors to display detailed information about people's adherence to a schedule. Based on this, they are able to identify whether people follow their schedules and if they come to work or leave as planned. It is possible to select the date range displayed (the maximum range is the range of imported data). If multiple days are selected, data in the report for each person are summed up. The Filters functionality allows the report to be filtered based on the events' details.
Please note that if a schedule that is older than 30 days is taken out of production and then put in production again, schedule adherence data older than 30 days will be lost. The reason for that is that schedule adherence data are recalculated with every update of the schedule based on raw people's statuses that are kept for 30 days only.
Displaying Adherence History
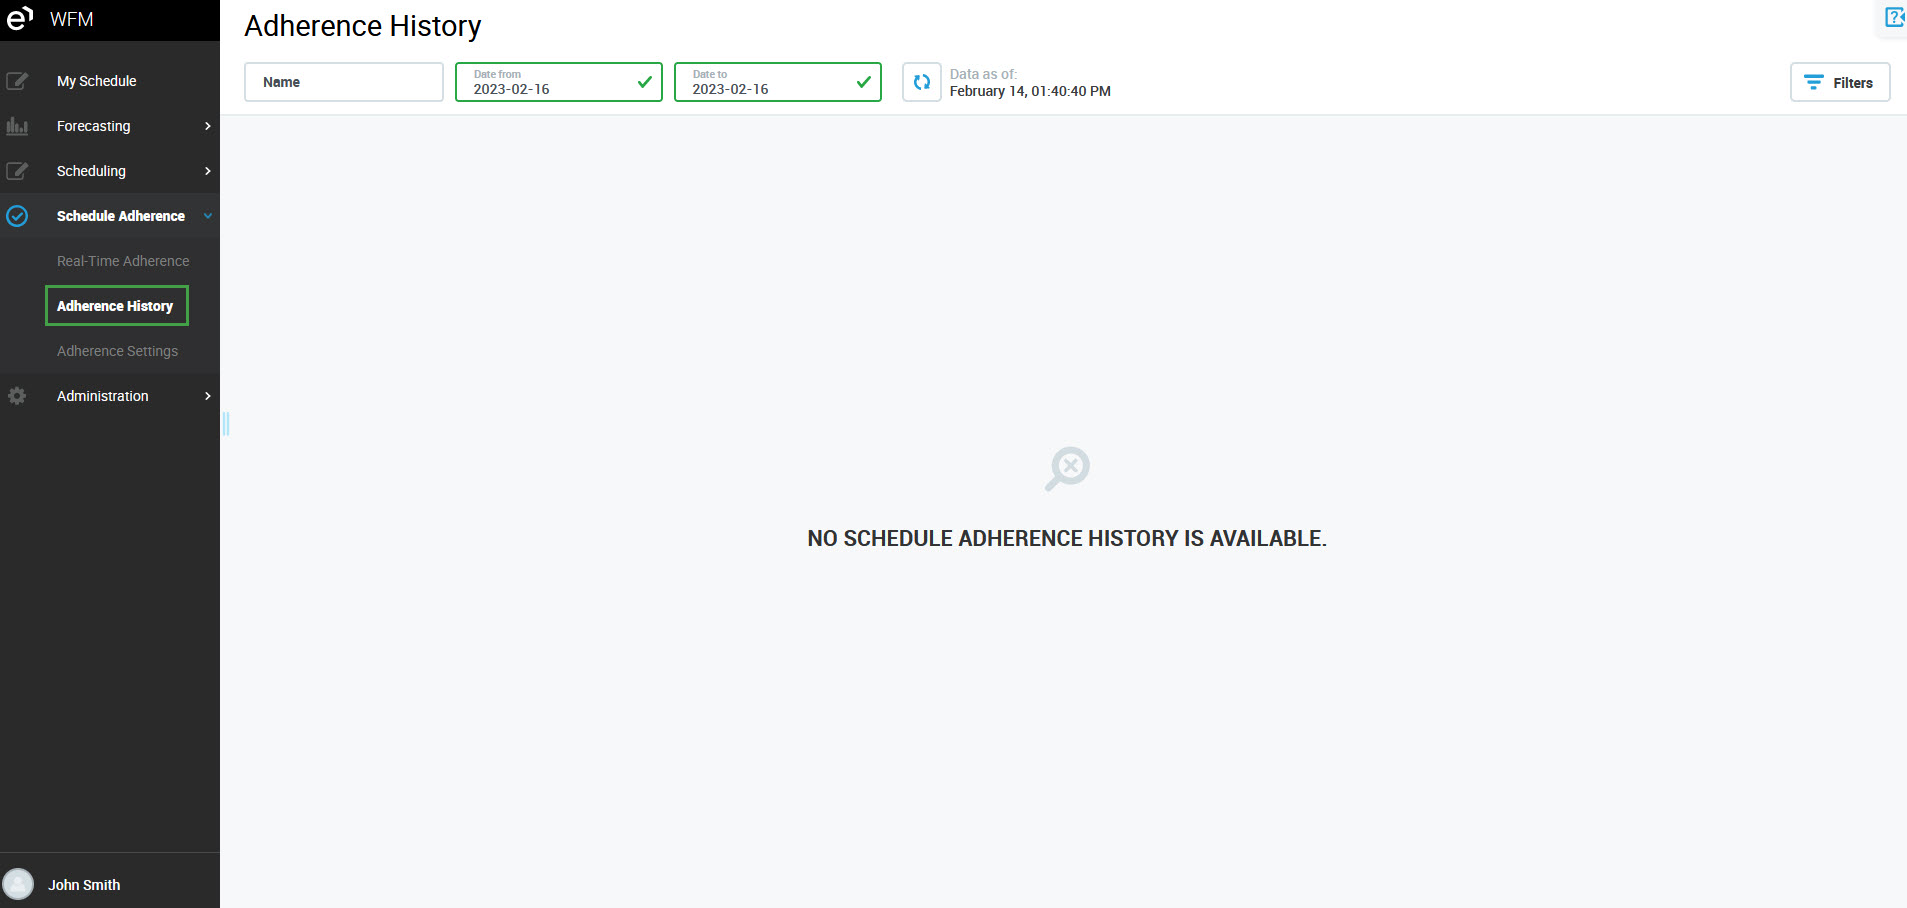
To display the Adherence History report, expand the Schedule Adherence module within the navigation tree and click Adherence History. The Adherence History screen will display.
By default, the current day is selected. Click on the Date from and Date to fields to select a different date range.
How to configure a date range?
Click here to read more...
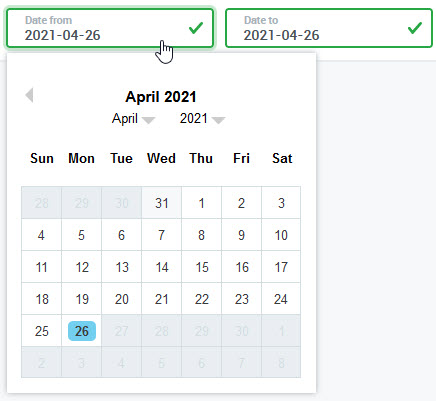
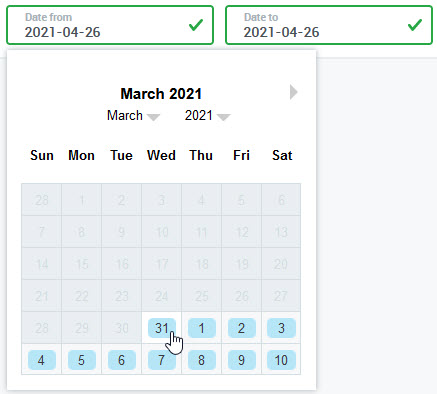
To configure a date range, click on the Date from field to expand the calendar.
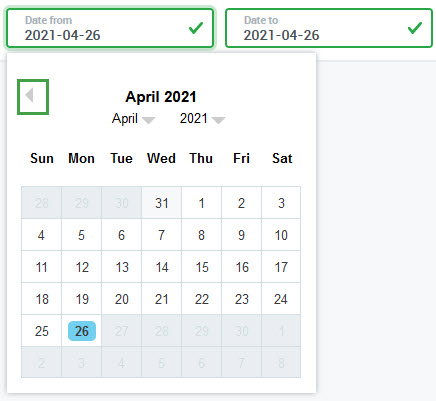
Use the arrow to navigate to a different month.
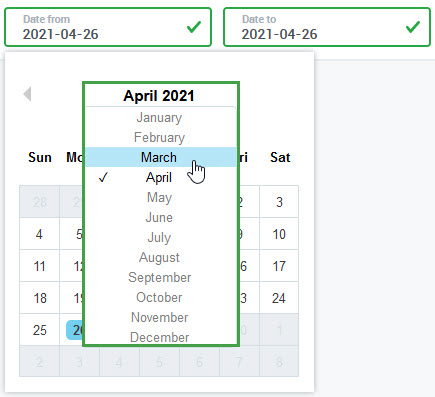
To quickly jump to a specific month or year, use the drop-down menus.
Click on a day to select it:
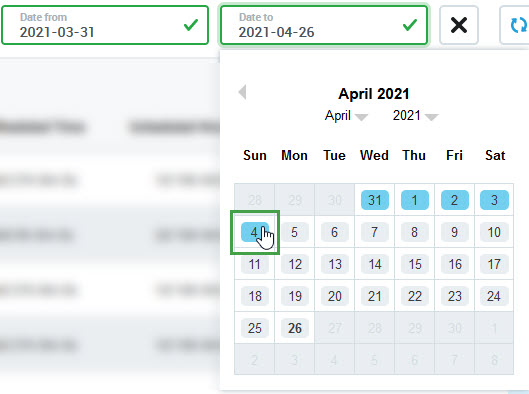
Then, click on the Date to field to expand the second calendar. Click on a day to select it, the selected range of dates will be marked in blue.
To clear the selection, click the Reset filter button:
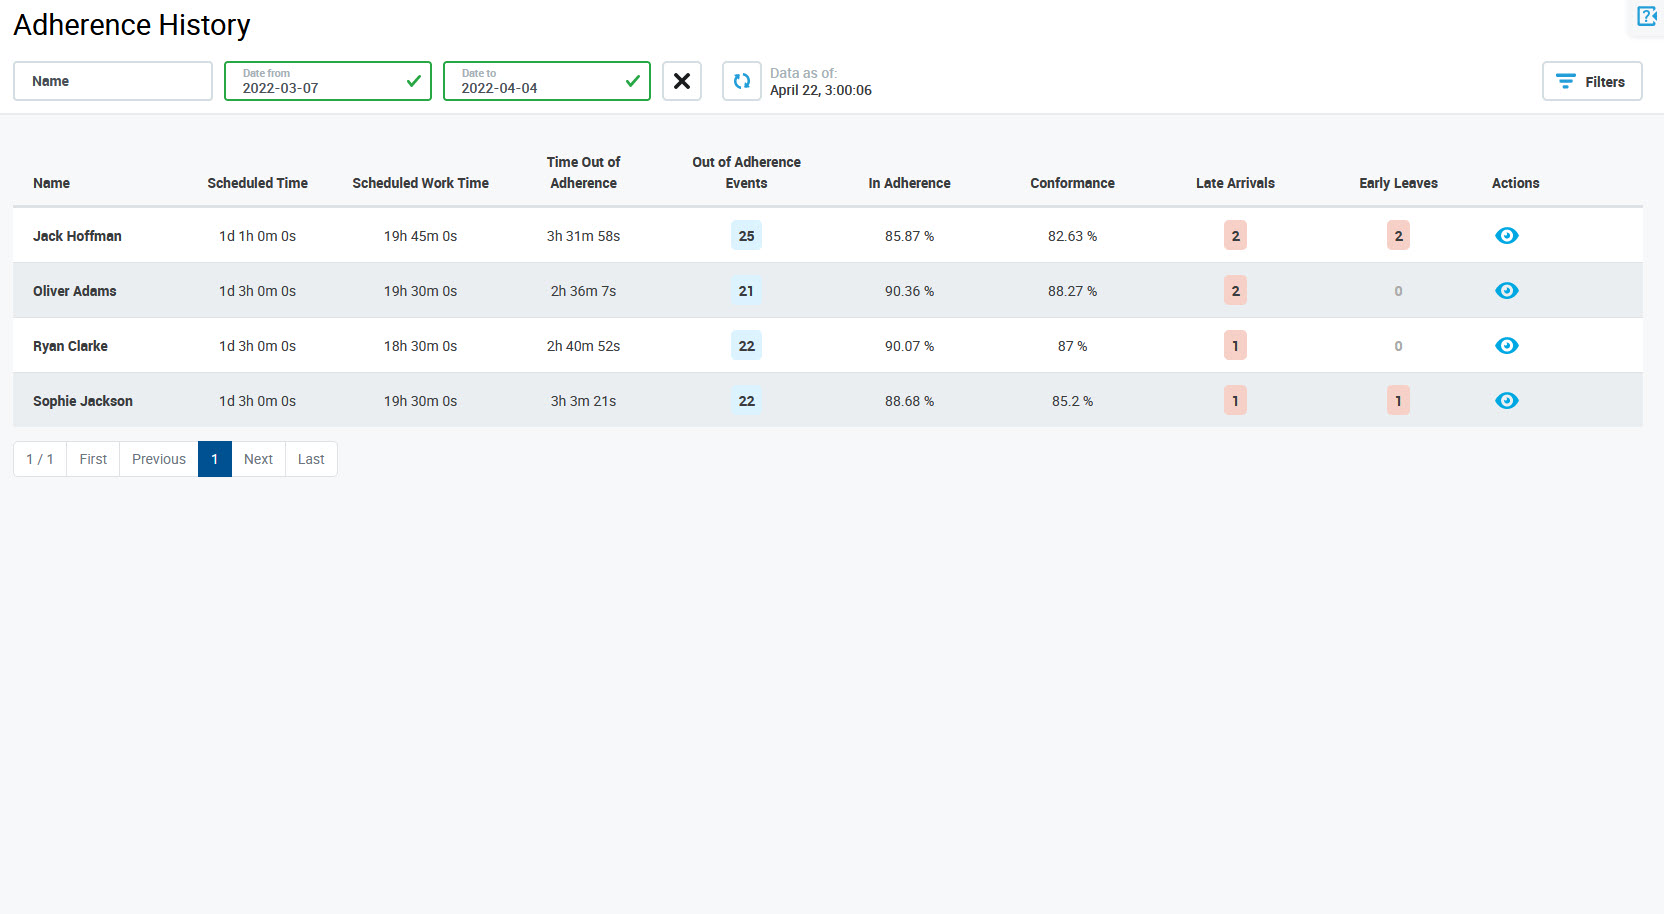
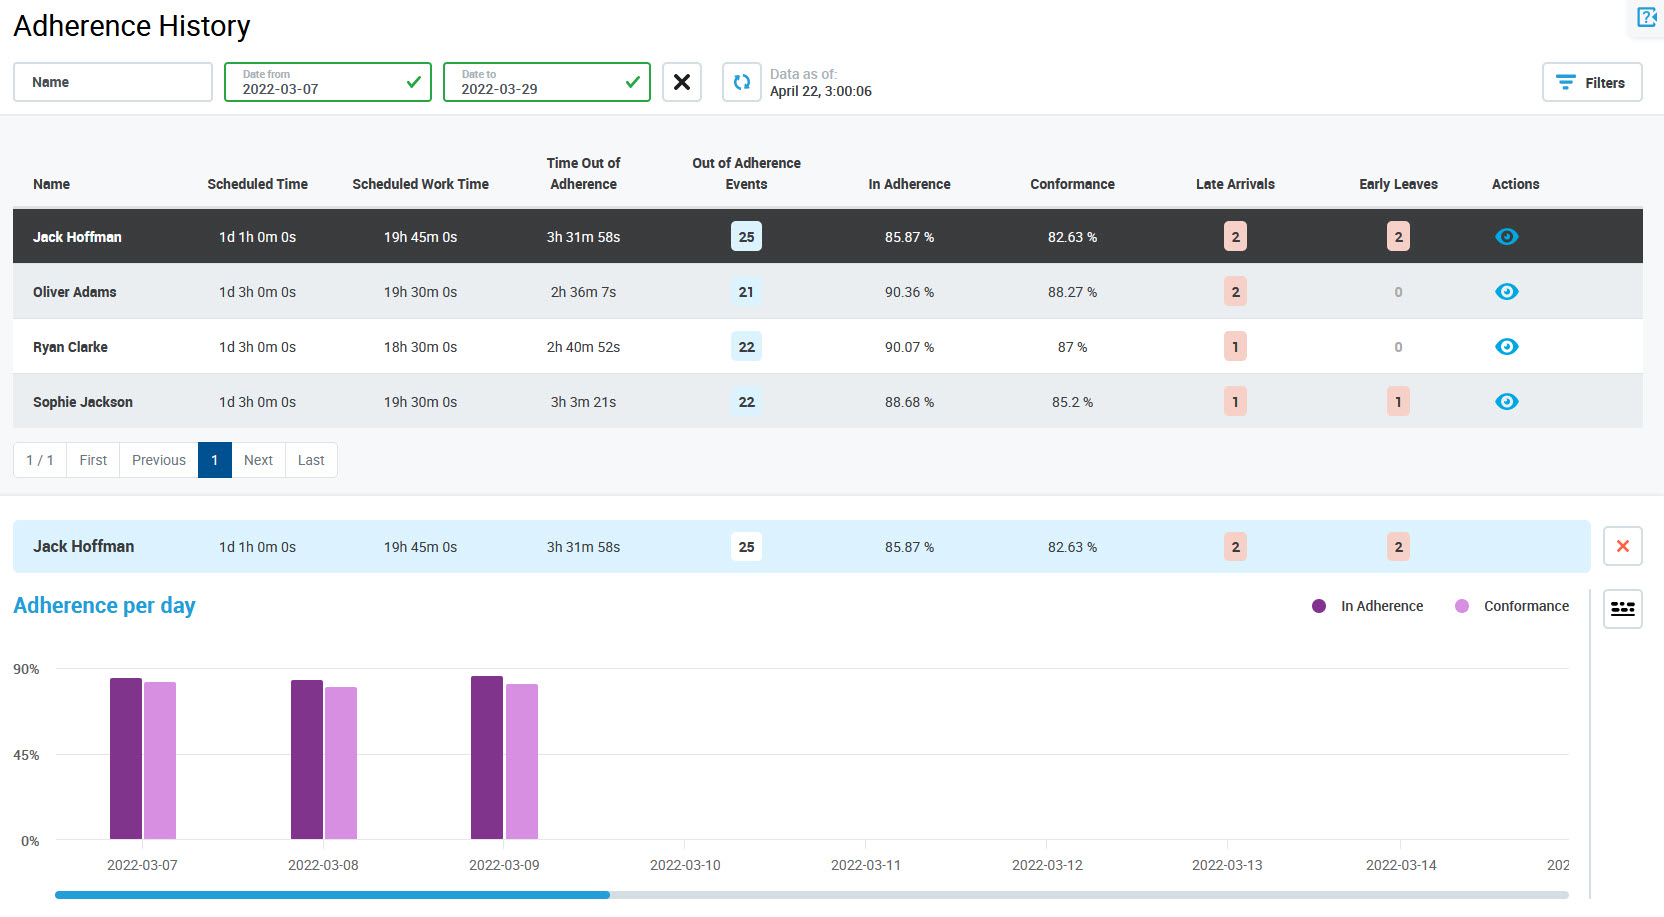
The Adherence History report will display:
Please note that adherence history is reported based on the time of a person's shift (the time zone which is set for this person in User Management). Select the correct time zone for each person in User Management to ensure that the Schedule Adherence history is correctly calculated and displayed on the timeline.
Click here to see an example...
Example:
A scheduler who is located in the UTC+2 time zone has planned a shift for a person on the 17th of April from 8 AM to 4 PM:
Because this person works in the UTC-7 time zone, his shift will start for him on the 16th of April at 11 PM (it will be a night shift, split between two days).
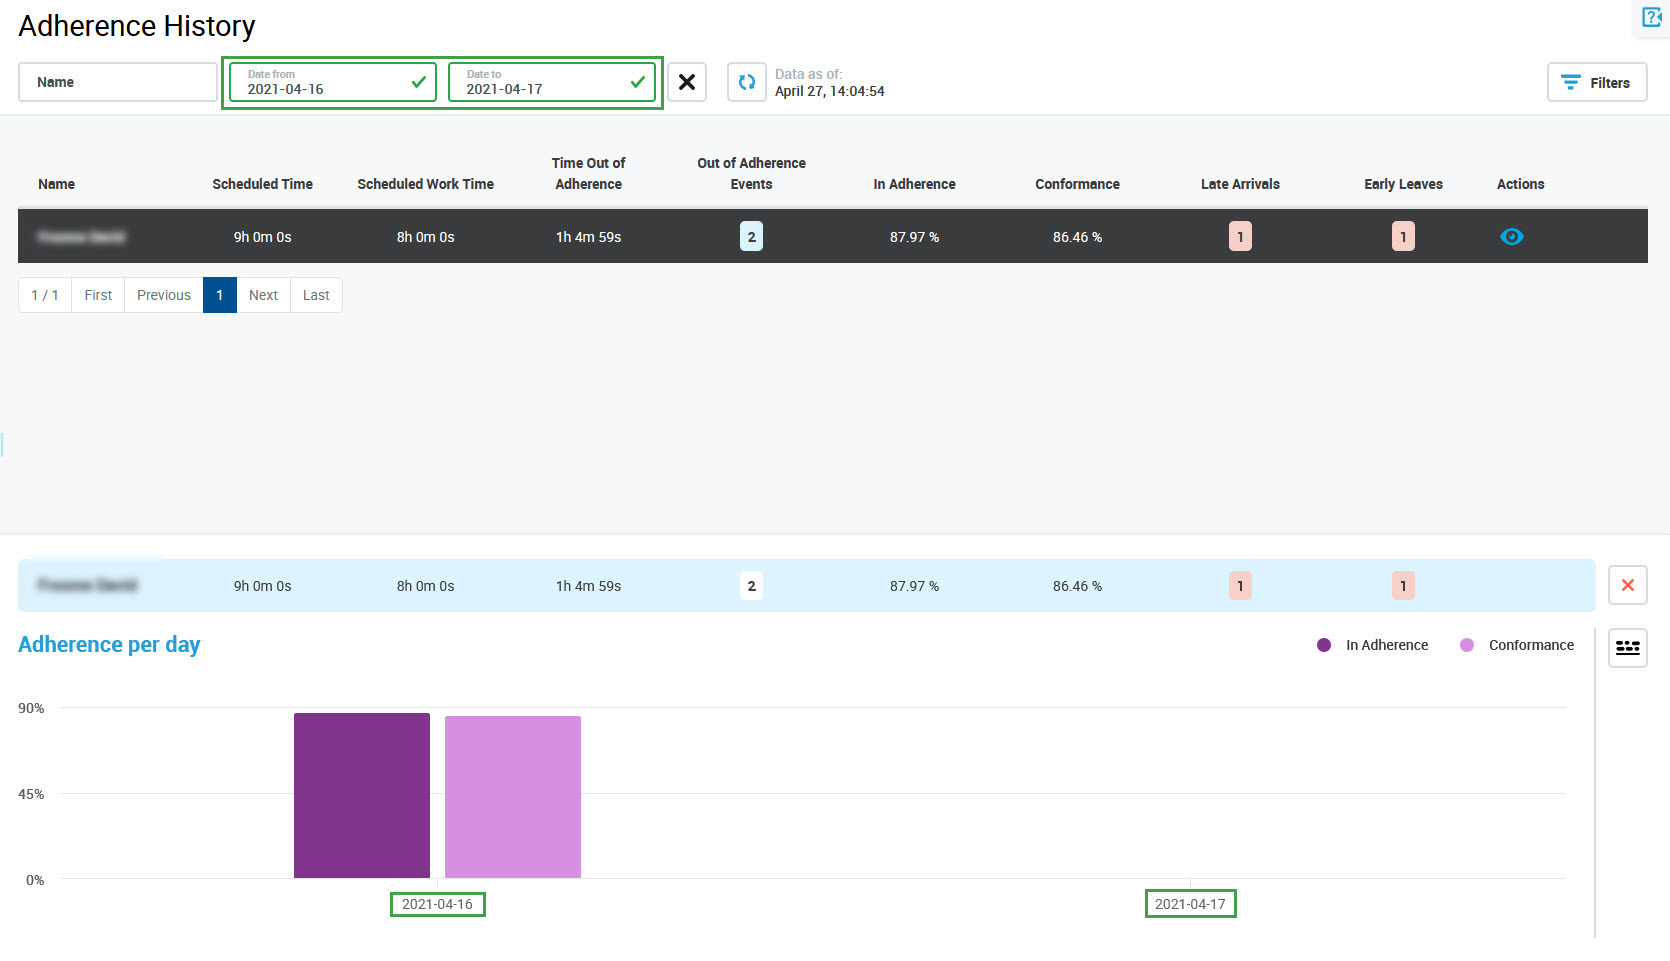
However, the adherence history data will be collected and reported on the 16th of April. The 17th of April will contain no data for this user:
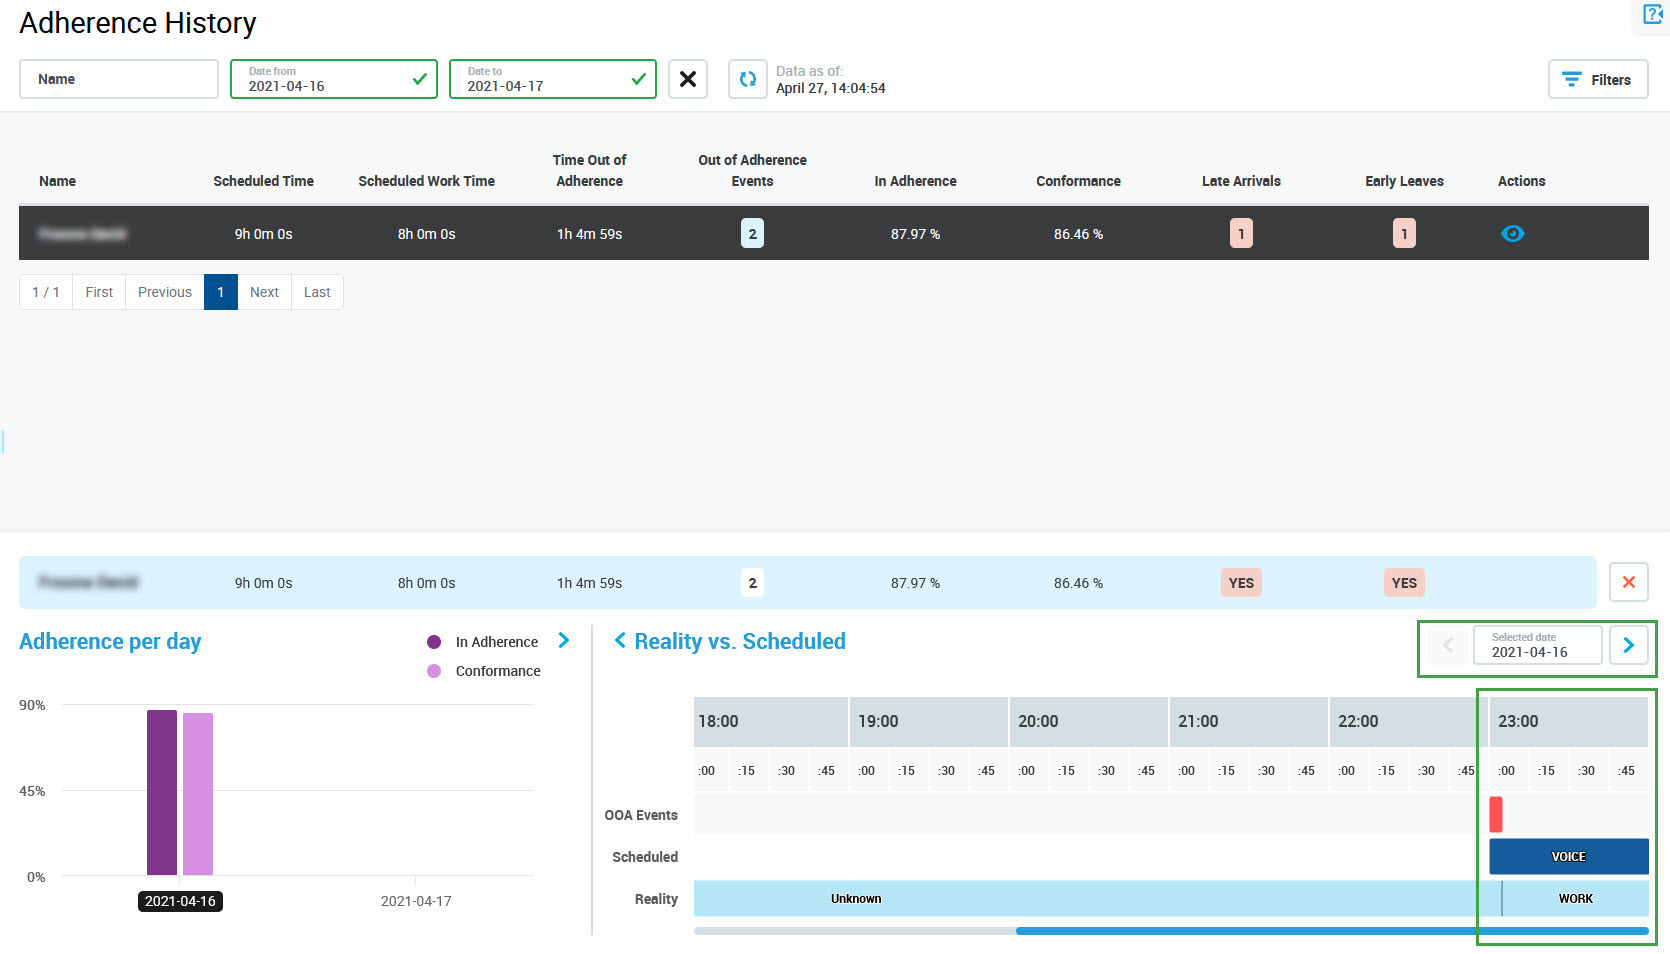
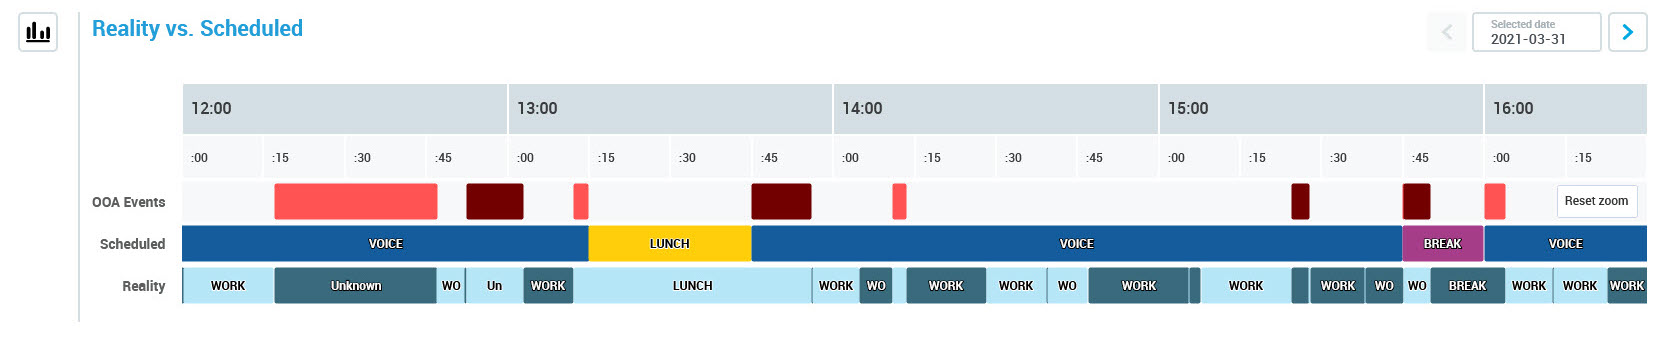
The Reality vs. Scheduled timeline shows that this is a night shift (the work event starts at 11 PM):
After changing the date, the rest of the events for this shift become visible on the 17th of April:
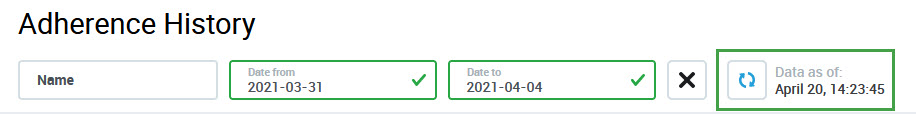
The date of the last data import is indicated at the top of the screen. Click on the Refresh () button to ensure that the data is up to date.
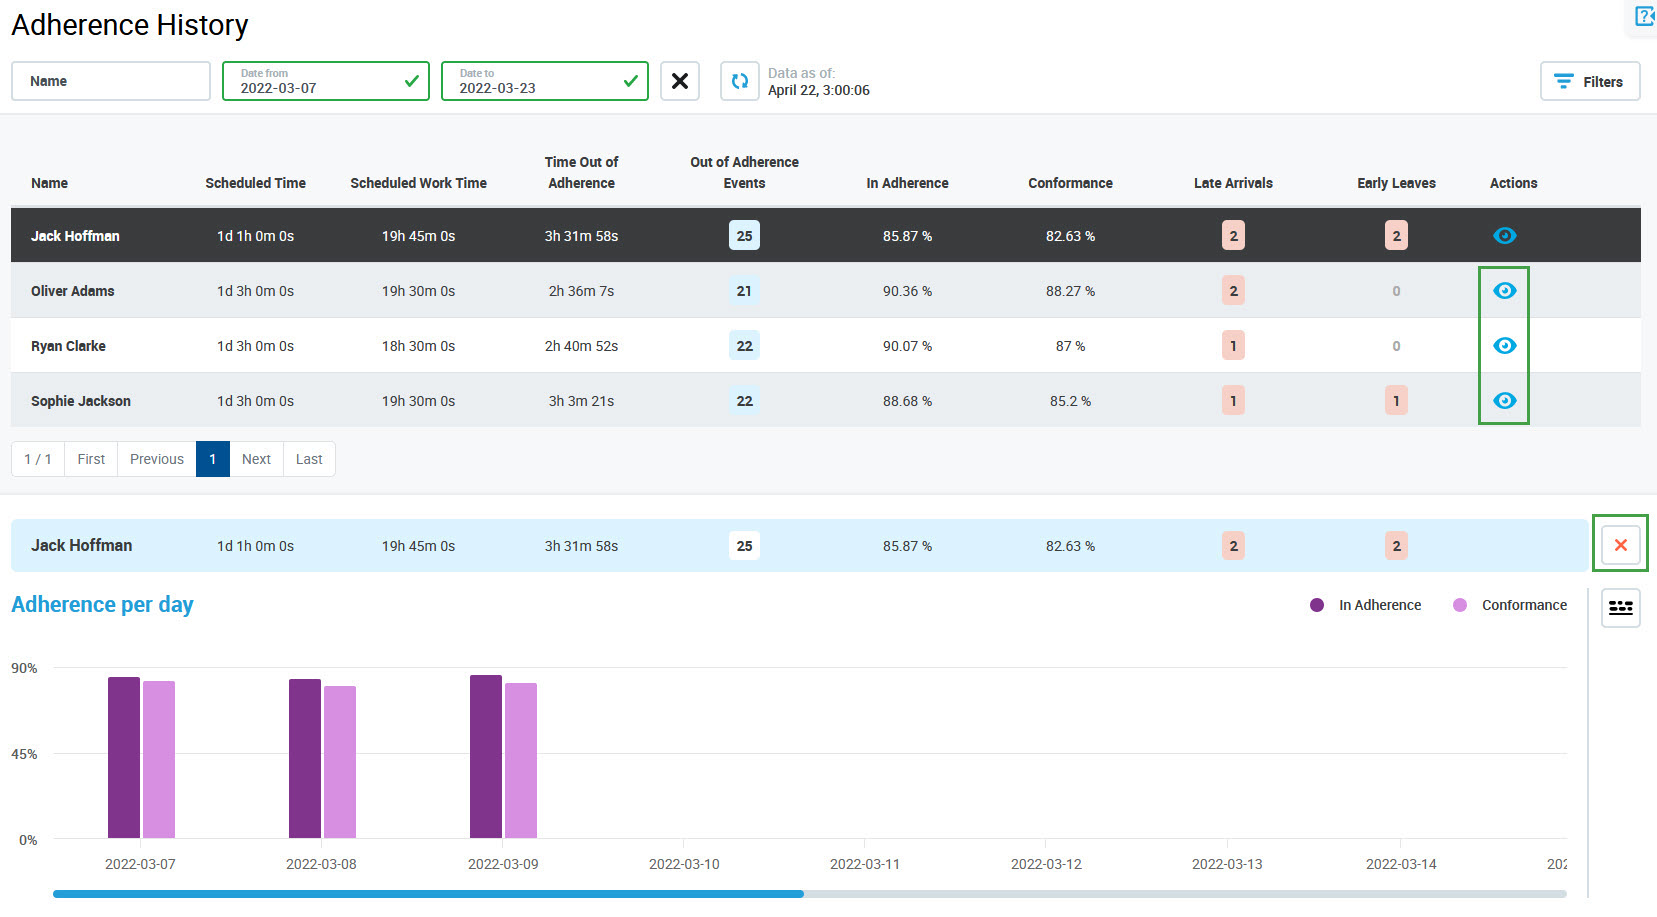
The report data are divided into the following columns:
Name – name of the person
Scheduled Time – total scheduled time (includes all scheduled activities, except Vacation, Sick and Holiday)
Scheduled Work Time – total scheduled work time (Voice, Chat, Email, Meeting, One on One, Training activities)
Time Out of Adherence – total time when a person was out of adherence
Out of Adherence Events – number of events when a person was out of adherence
In Adherence – percentage of time when a person really worked and was scheduled to work (includes call time, after call wrap, and scheduled activities like meetings or trainings), maximum is 100%
Conformance – percentage of time when a person was scheduled to work and they actually worked, can exceed 100%
Late Arrivals – number of late arrivals to work
Early Leaves – number of times the agent departed earlier than expected
TheActioncolumn allows further action related to the person:
the View button () allows the details to be viewed, but not modified – this option isavailable to a user with the WFM_ANALYST role assigned and to a user with the WFM_SCHEDULER role assigned.
Viewing Details
Click the View () button to display the adherence report for the selected person.
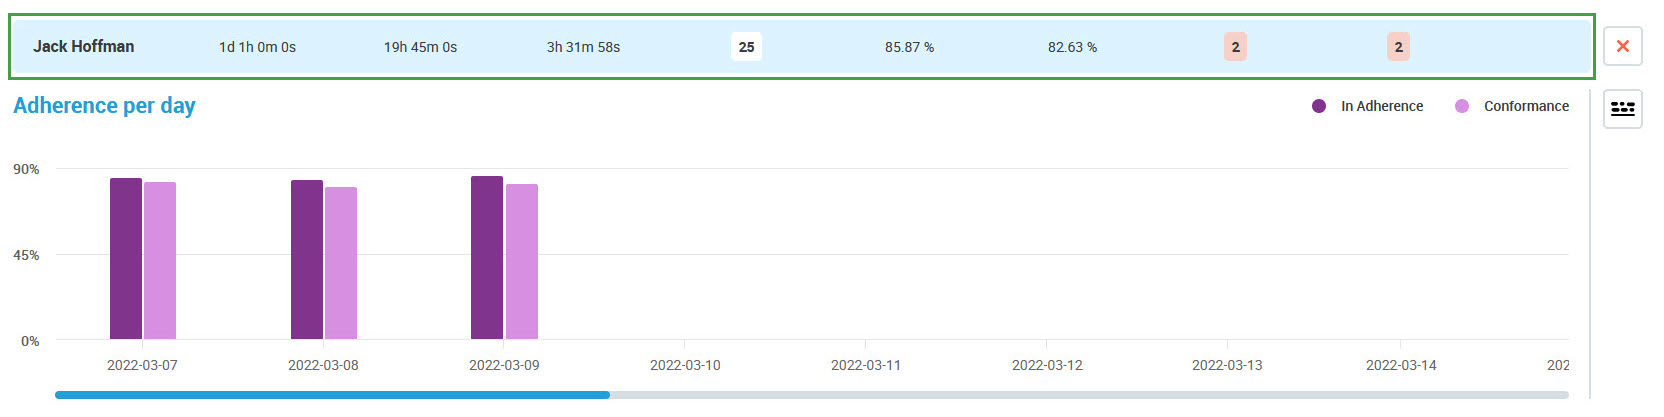
The details will display at the bottom of the screen.
The adherence report for the selected person is displayed just above the graph.
The maximum date range is limited to the date range of imported data. However, the detailed view (the Reality vs. Scheduled timeline) is only available for the last 30 days. If the 'Date to' value is more than 30 days in the past, the View button is not active (details cannot be viewed).
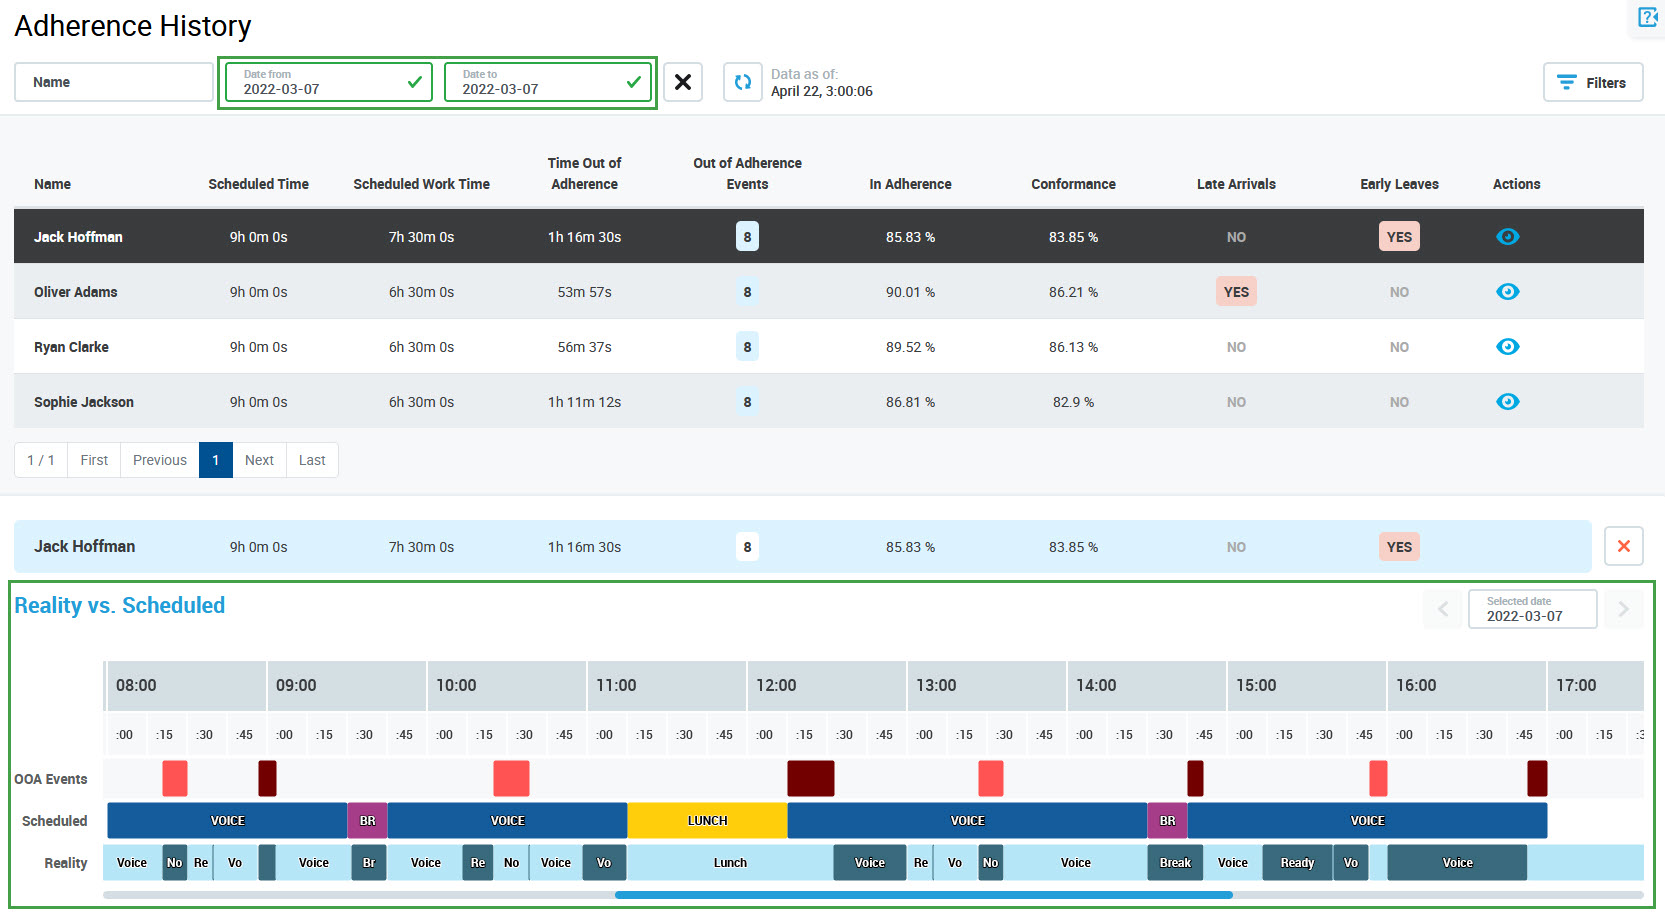
If the selected date range contains one day only, the graph will not display. The Reality vs. Scheduled timeline will display instead.
Adherence per Day
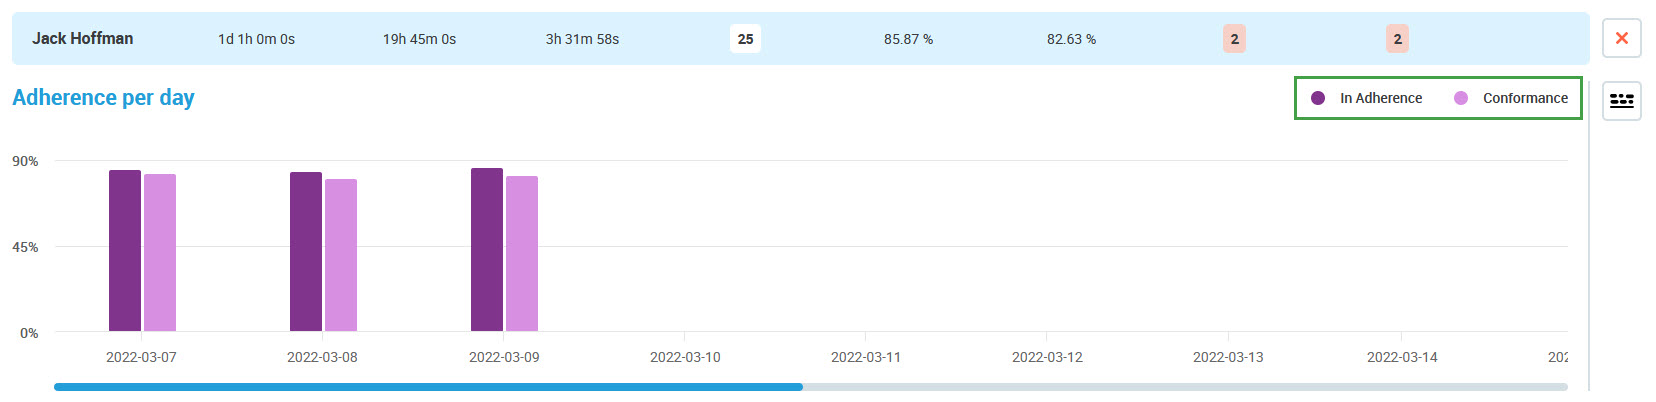
The graph that displays by default illustrates adherence per day for the selected person. The left bar (dark pink) shows the time in adherence, while the right bar (light pink) shows conformance (both in percent).
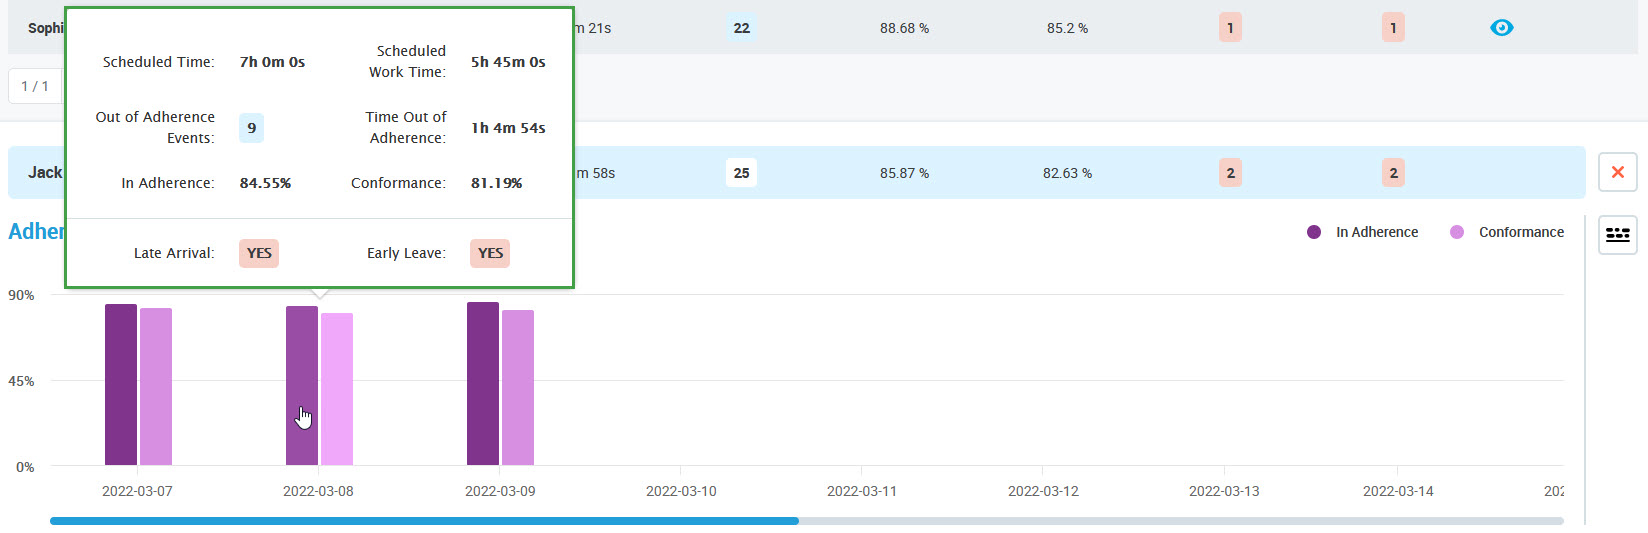
Hover the mouse pointer over the bars to display a tooltip with details
The tooltip contains the same information as the table above but calculated for the particular day only:
Scheduled Time – total number of scheduled hours (includes all scheduled activities, except Vacation, Sick and Holiday)
Scheduled Work Time – total number of scheduled work hours (Voice, Chat, Email, Meeting, One on One, Training activities)
Time Out of Adherence – total number of hours when the person was out of adherence
Out of Adherence Events – number of events when the person was out of adherence
In Adherence – percentage of time when the person really worked and was scheduled to work (includes call time, after call wrap, and scheduled activities like meetings or trainings);
Conformance – percentage of time when the person was scheduled to work and they actually worked
Late Arrivals – number of late arrivals to work
Early Leaves – number of early departures from work
Note the following values:
Late Arrival – This out-of-adherence event is logged when before the beginning of the schedule, a person doesn't set a status that is mapped with the first scheduled activity.
Click here to see an example
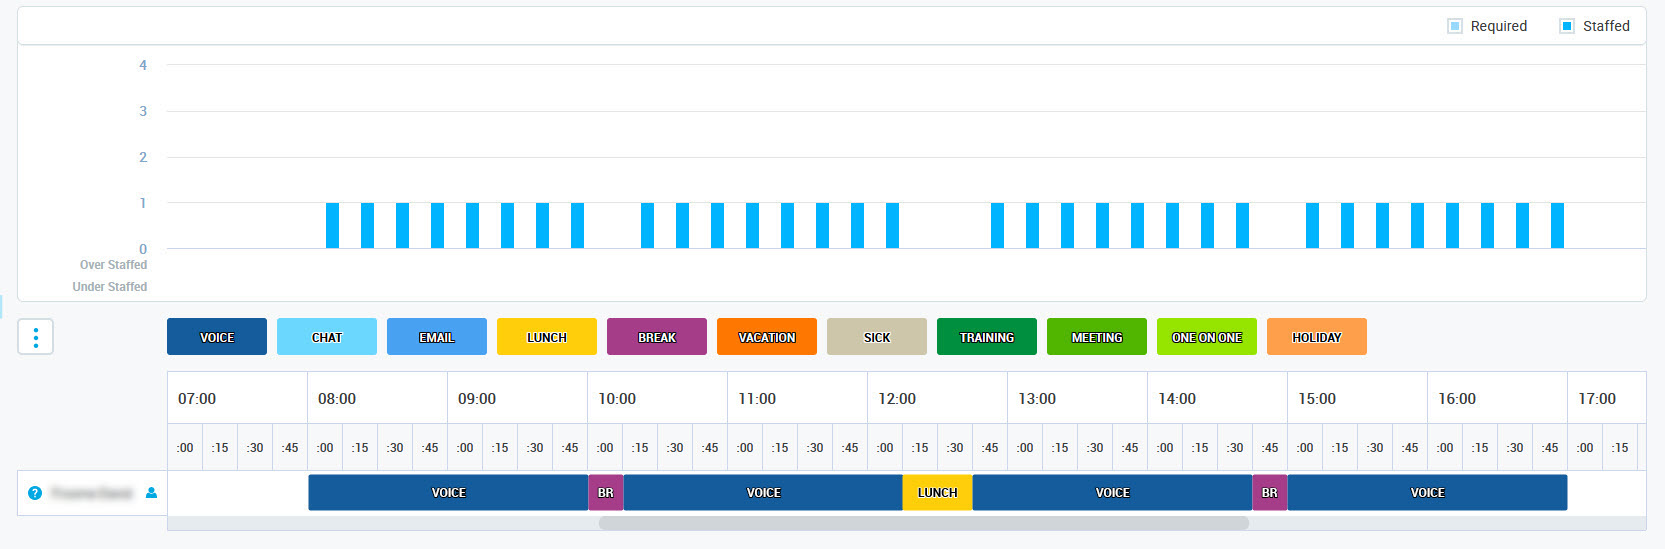
The first scheduled activity for John Smith is 'Voice' that starts at 8:00. The status mapped to the 'Voice' activity is 'Ready -Log in'.
However, at 8:00 John Smith is still in 'Not Ready - End of Shift' status. He overslept, so he comes to the office at 8:15 and then changes his status to 'Ready'.
As a result, between 8:00 and 8:15, John Smith is out of adherence and late arrival is logged.
Early Leave – This out-of-adherence event is logged when before the end of the schedule, a person sets a status that is not mapped to the currently scheduled activity and remains in this status until the end of the schedule for this day.
Click here to expand...
The shift should end for Emily Moore at 16:30. Her last scheduled activity is 'Voice', from 15:00 to 16:30. The status mapped to the 'Voice' activity is 'Ready - Log in'.
However, at 16:25 she leaves the office, changing her status to 'Not Ready - End of Shift'.
As a result, between 16:25 and 16:30, Emily Moore is out of adherence and early leave is logged.
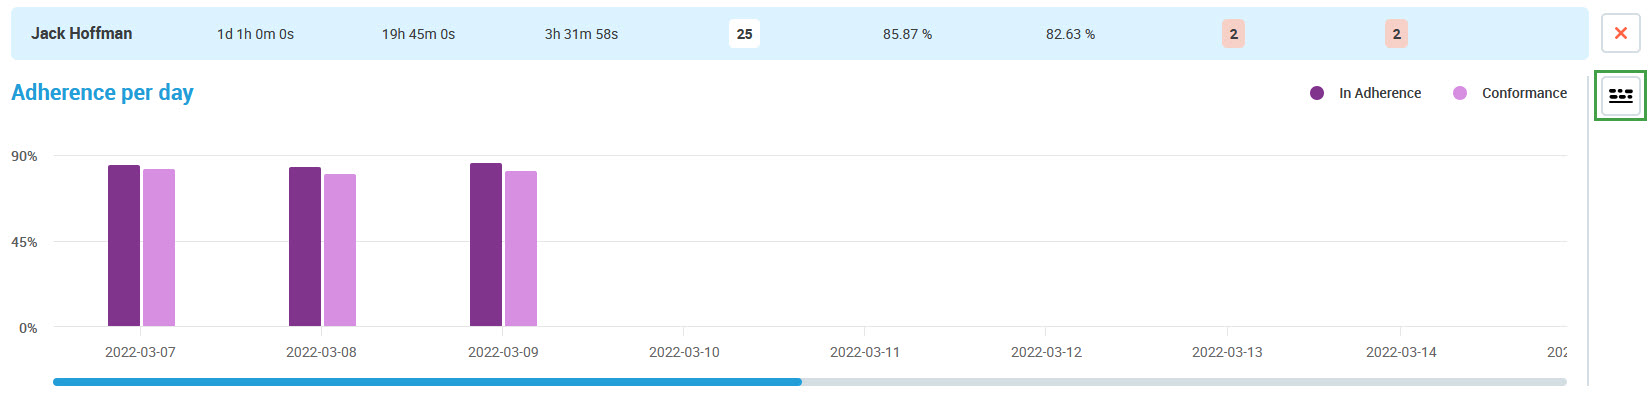
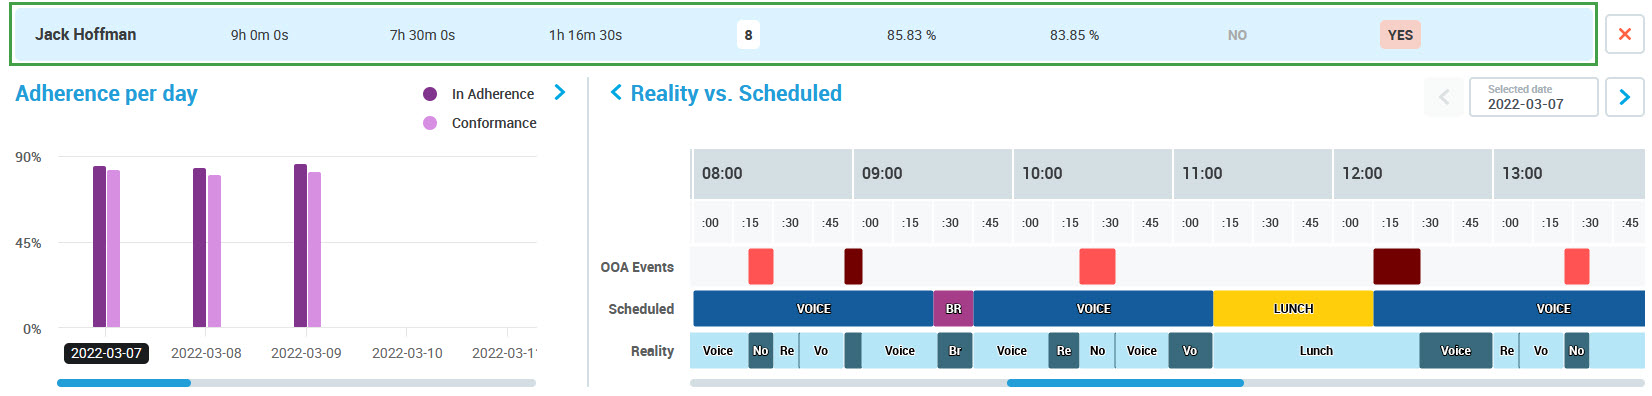
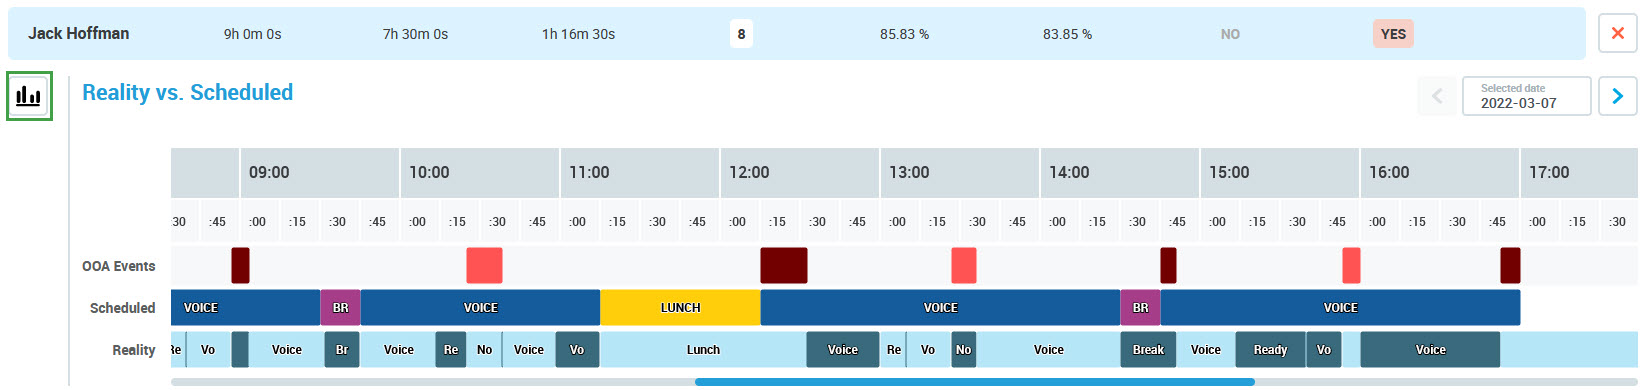
Reality vs. Scheduled
Click the Daily overview () button on the right to compare real events with the schedule for a particular day. Alternatively, click on the bar on the Adherence per day graph to display the timeline for the selected day.
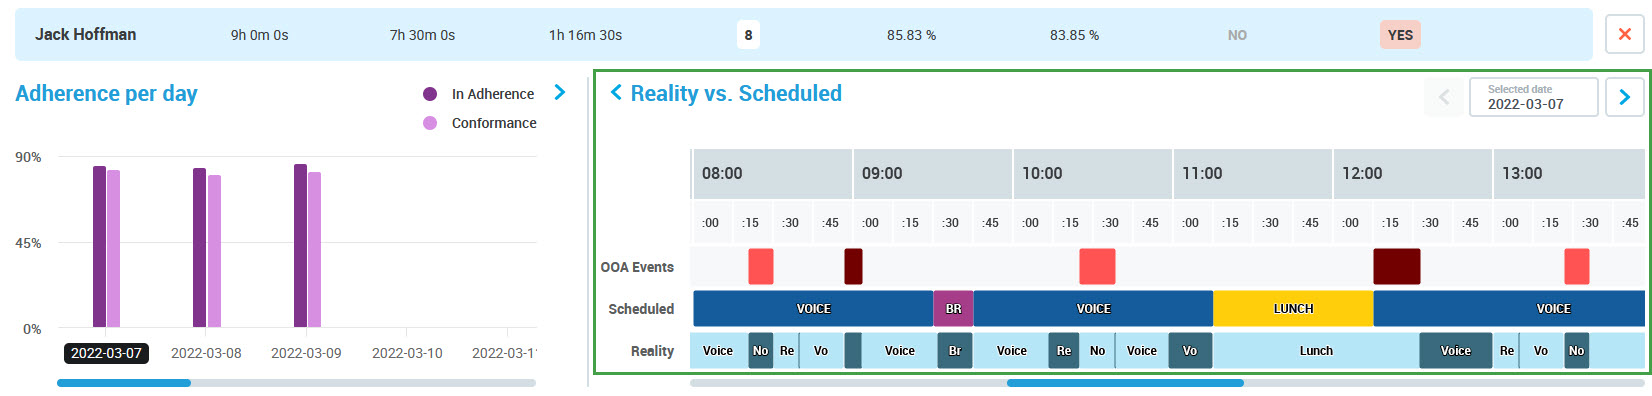
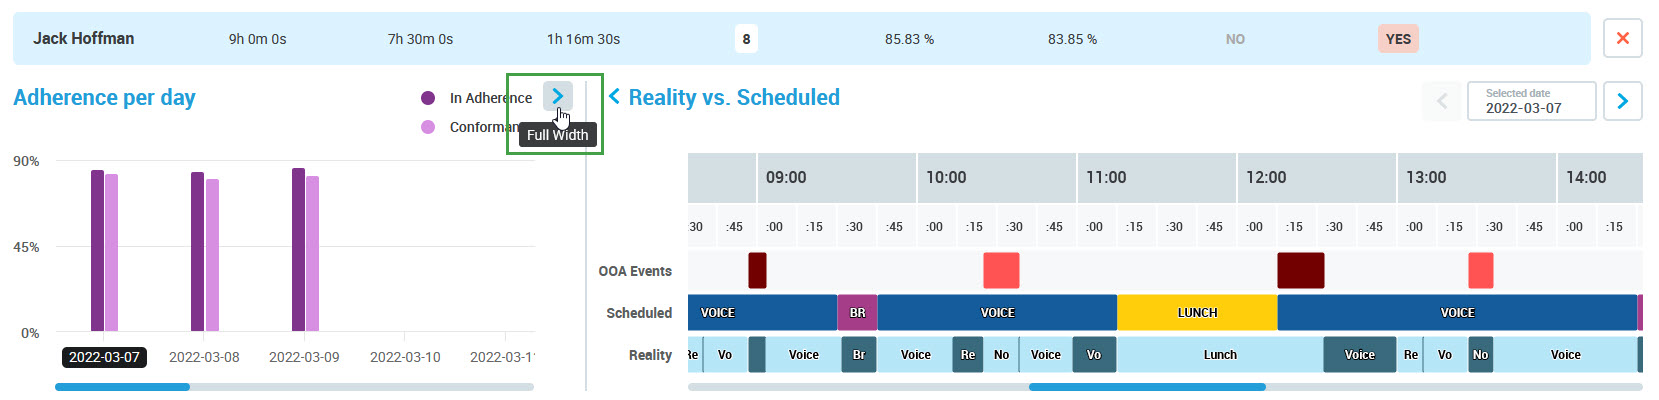
The Adherence per day graph will shrink and the Reality vs. Scheduled timeline will display in the bottom right corner of the screen.
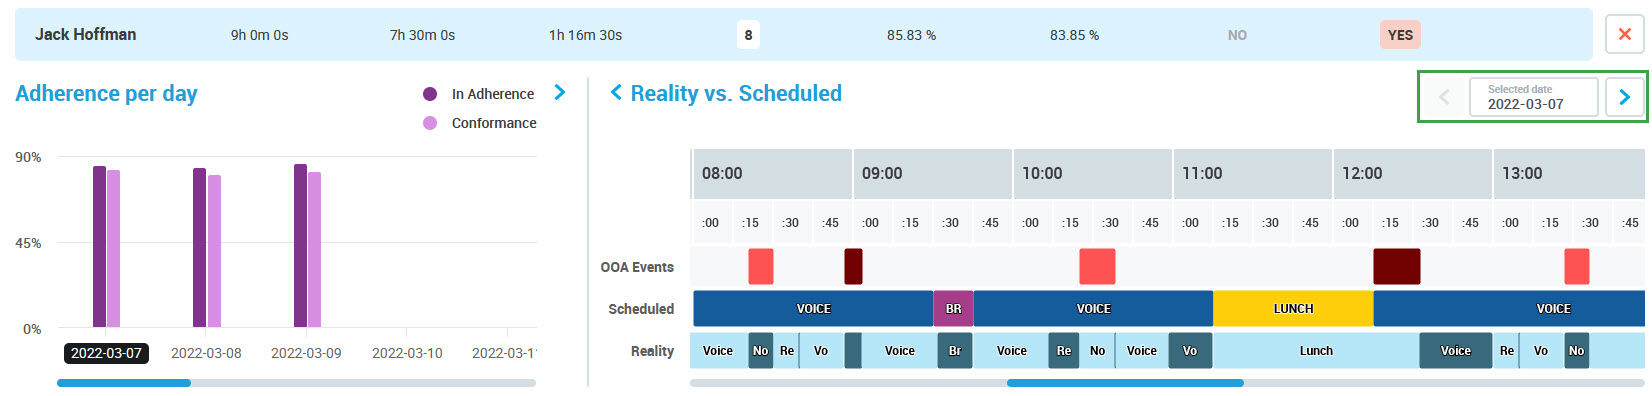
By default, the first day of the selected date range will display. If the timeline was displayed by clicking on a bar, the selected day will display.
Use the arrows to navigate between days or click on a different day on the Adherence per day graph.
The blue bar with the person's report will contain data only for the currently displayed day.
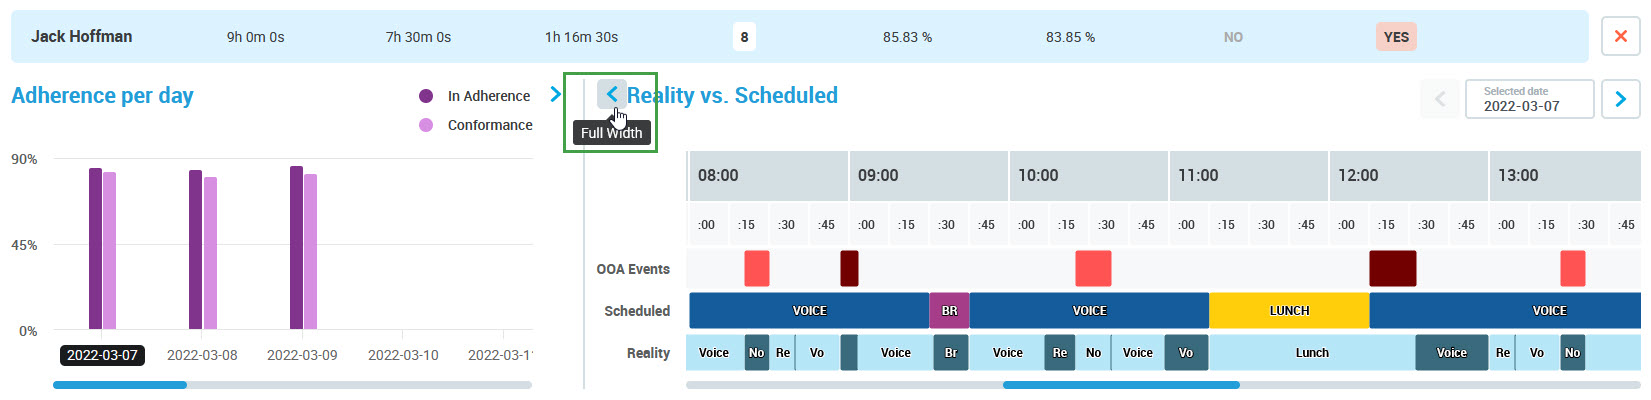
Use an arrow (the Full Width button) to expand the timeline to the full width of the screen and hide the Adherence per day graph.
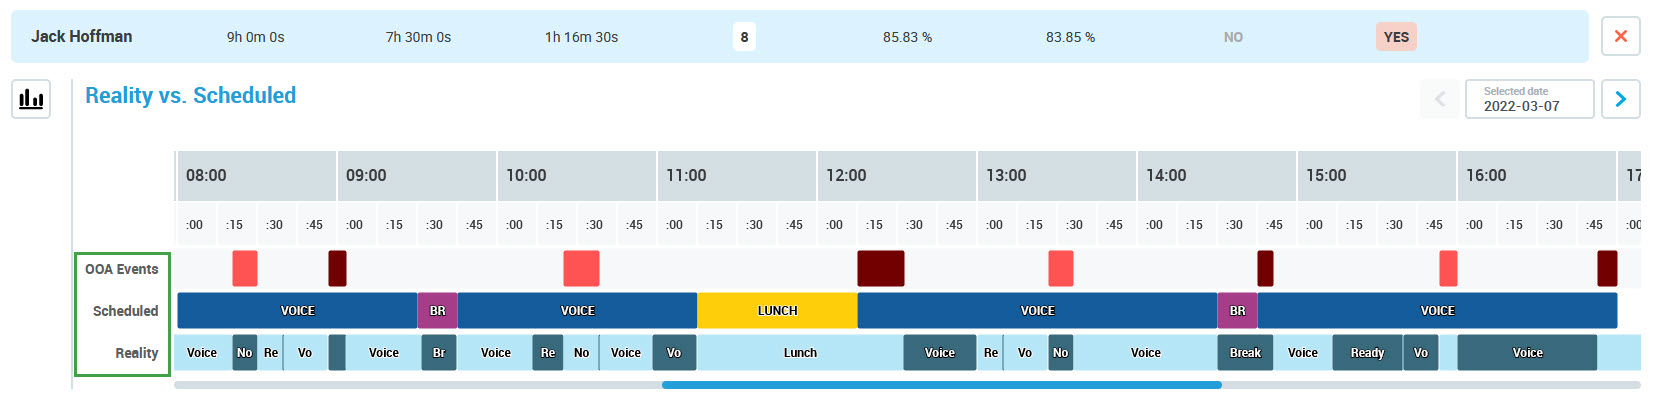
The timeline for a day contains the following rows:
OOA Events – time when a person is out of adherence (marked in red)
Scheduled – scheduled activities
Reality – Eleveo Statuses based on the real statuses of the person
Evaluating Out of Adherence
The OOA Events row highlights in red all periods when a person was out of adherence. It is evaluated based on the mapping of scheduled activities to ACD Statuses set by a person. If the real status (ACD Status) set by the person is not mapped to the activity scheduled for the same time (mappings are configured on the Adherence Settings page), it is evaluated as out of adherence and marked in red in the OOA Events row.
If the ACD Status is added to an Eleveo Status (on the Adherence Settings page), the name of the Eleveo Status will display in the Reality row. However, if the ACD Status that appeared in the adherence history was not added to any Eleveo Status, the real name of the ACD Status will display in the Reality row.
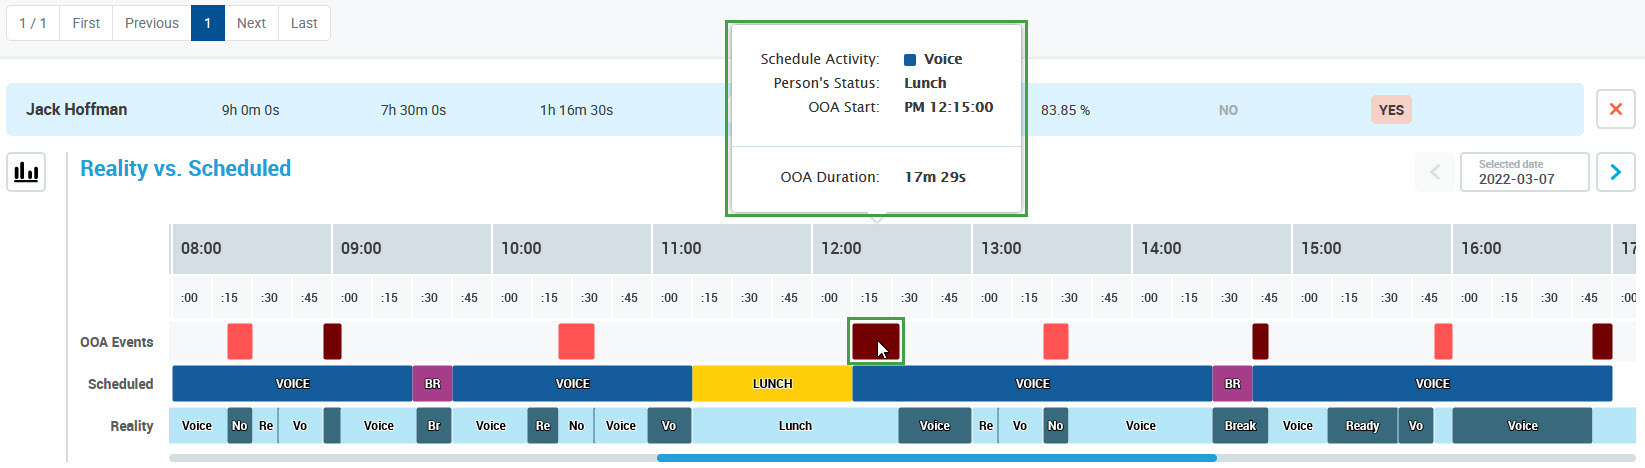
Hover the mouse pointer over the OOA Events to display a tooltip with details.
The tooltip contains the following information about an event:
Schedule Activity – person's activity according to the schedule
Person's Status – real status set by the person (name of the Eleveo Status, or name of the ACD Status if the ACD Status is not added to any Eleveo Status)
OOA Start – beginning of the out of adherence event
OOA Duration – duration of the out of adherence event
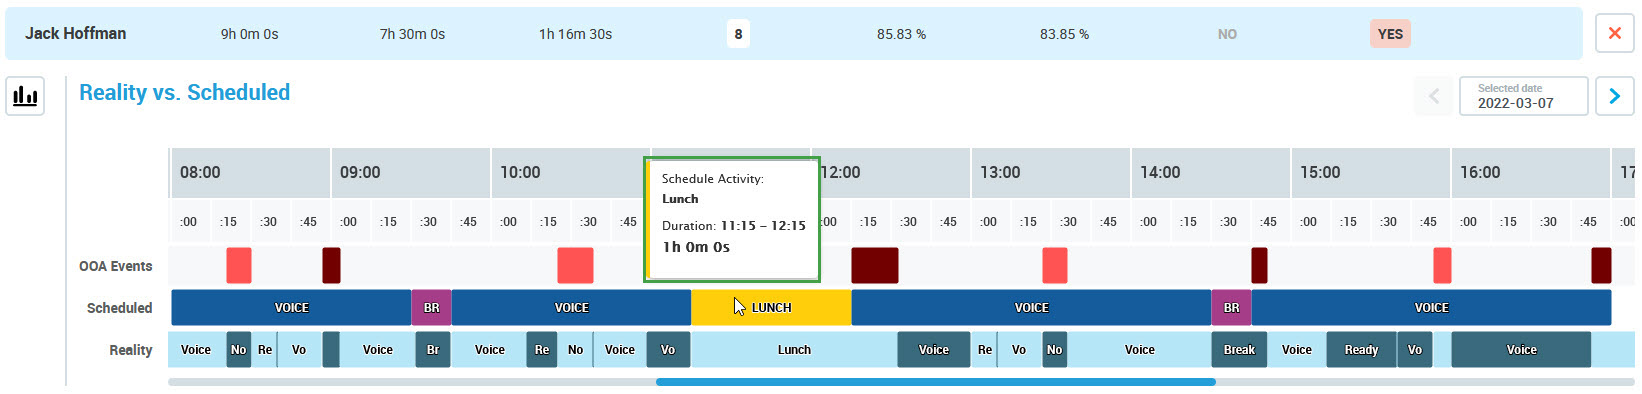
Hover the mouse pointer over a Scheduled event to display the tooltip with details.
The tooltip contains the following information about an event:
Schedule Activity – name of the event (scheduled activity)
Duration – duration of the event
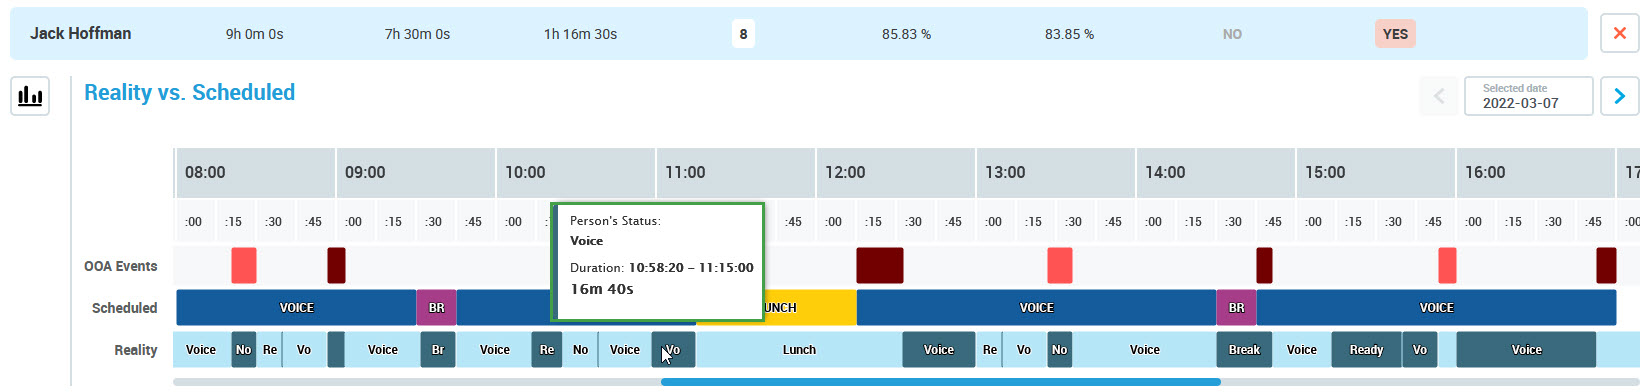
Hover the mouse pointer over a Reality event to display the tooltip with details.
The tooltip contains the following information about an event:
Person's status – name of the event (name of the Eleveo Status, or name of the ACD Status if the ACD Status is not added to any Eleveo Status)
Duration – duration of the event
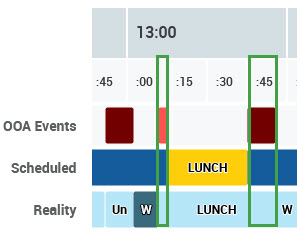
Example
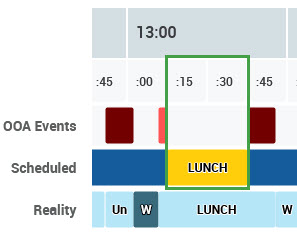
A person was scheduled to have a lunch break from 13:15 to 13:45 (yellow activity on the timeline), and to work before and after this break (dark blue activities on the timeline)
However, the real data does not match the schedule. The person logged 'lunch' status in the ACD person around 13:10, and it lasted until 13:55.
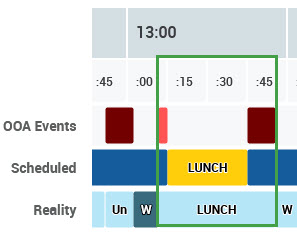
As a result, out of adherence events are marked from 13:10 to 13:15, and from 13:45 to 13:55.
Zooming the Timeline
By default, the timeline represents one day, but periods without any events at the beginning and at the end of the day are cut out. Use the scroll bar at the bottom to scroll the timeline:
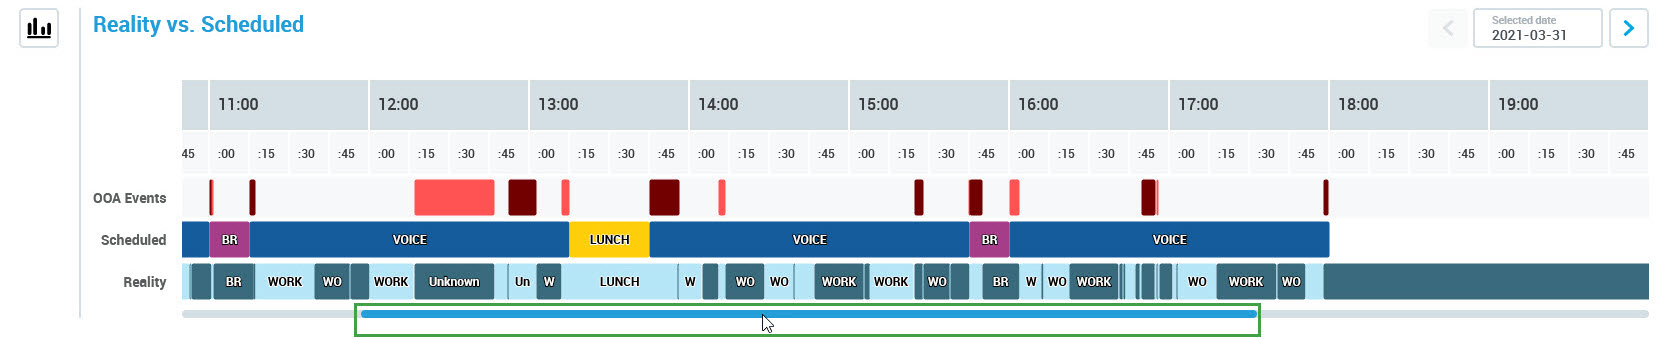
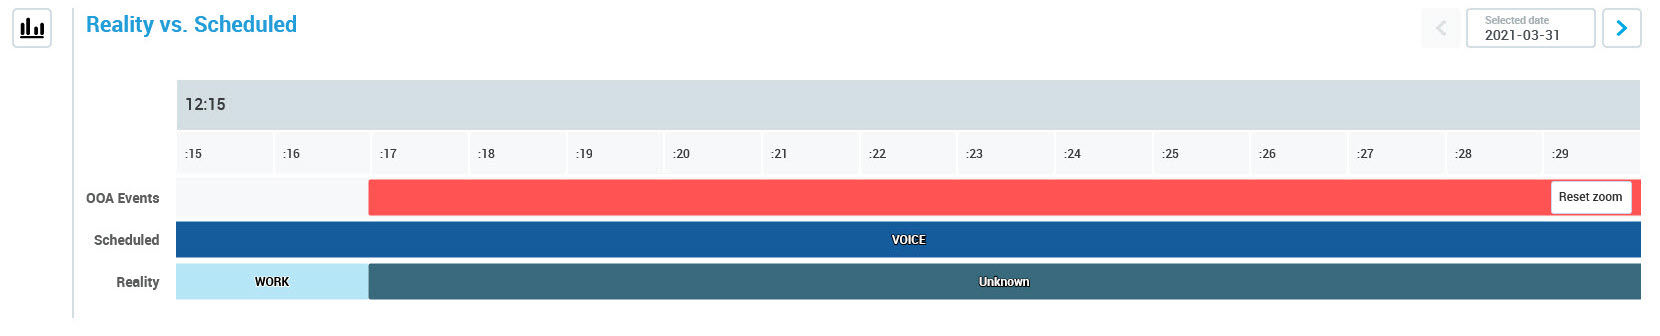
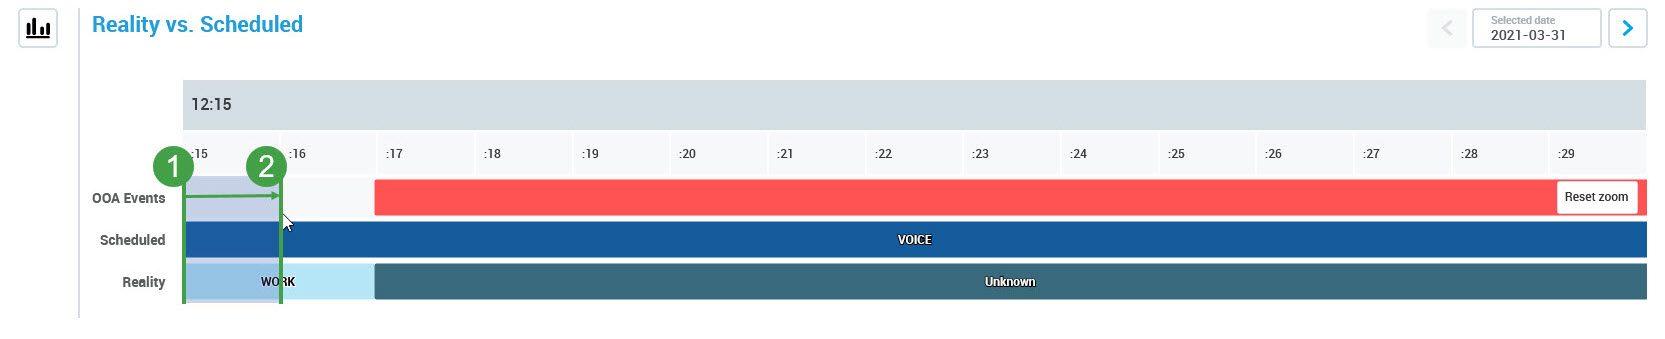
To zoom in on the timeline, click on the area of the OOA Events/Scheduled/Reality bars (not on the hours or minutes) and keeping the mouse button pressed, move along the period that should be zoomed, for example from 12:00 to 15:00.
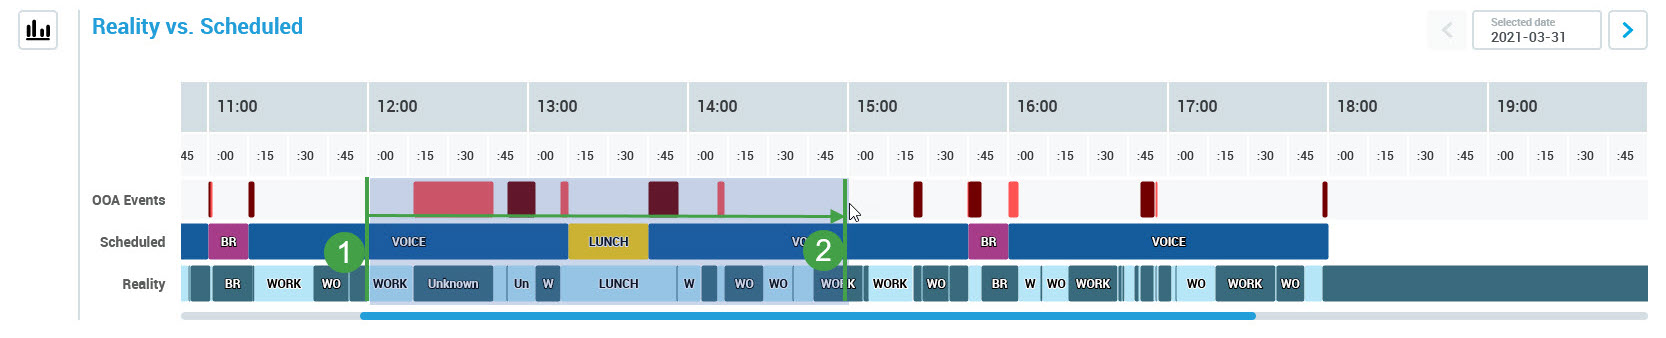
The selected period of time will be zoomed in.
It can be maximally zoomed in to display a 15 minute block of time.
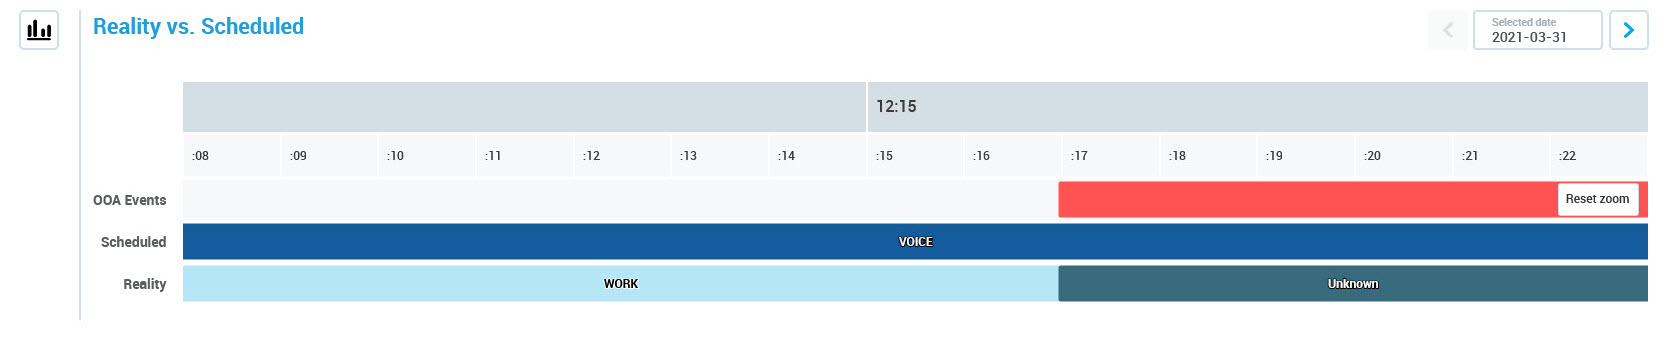
Now, the scroll bar is not available at the bottom, but the timeline can be moved using the zoom function on the far right/left of it.
As a result, the timeline will move:
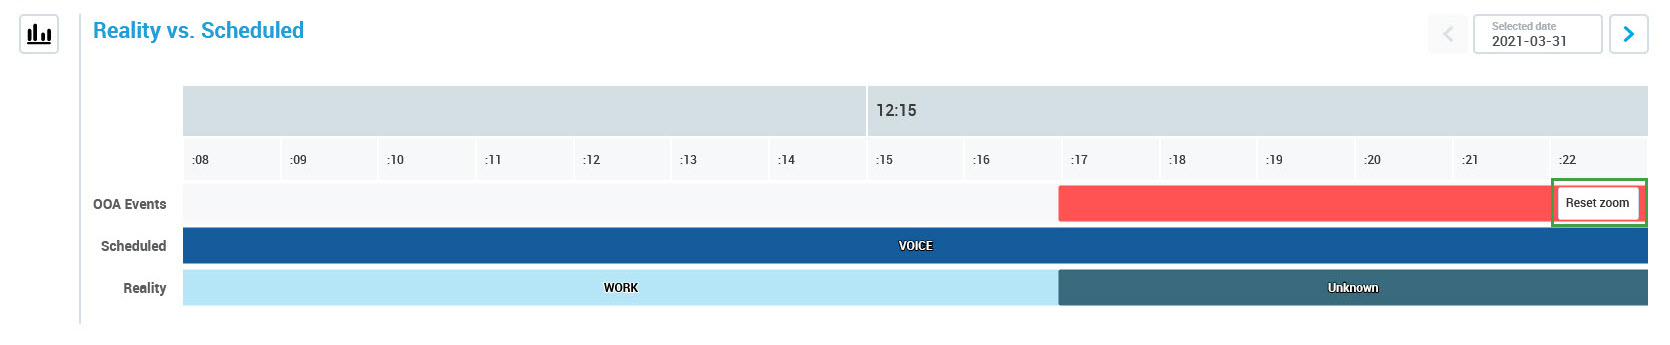
Click Reset zoom to display the full timeline.
Switching Back to Adherence per Day
Click the Multi-Day Overview button to display the Adherence per day graph.
Use an arrow (the Full Width button) to expand the graph to the full width of the screen and hide the timeline.
Click the Close button to hide details. Alternatively, click the View button to display details for a different person.
Filtering Adherence History Reports
It is possible to filter the Adherence History reports that will be displayed, based on a name or based on configured criteria.
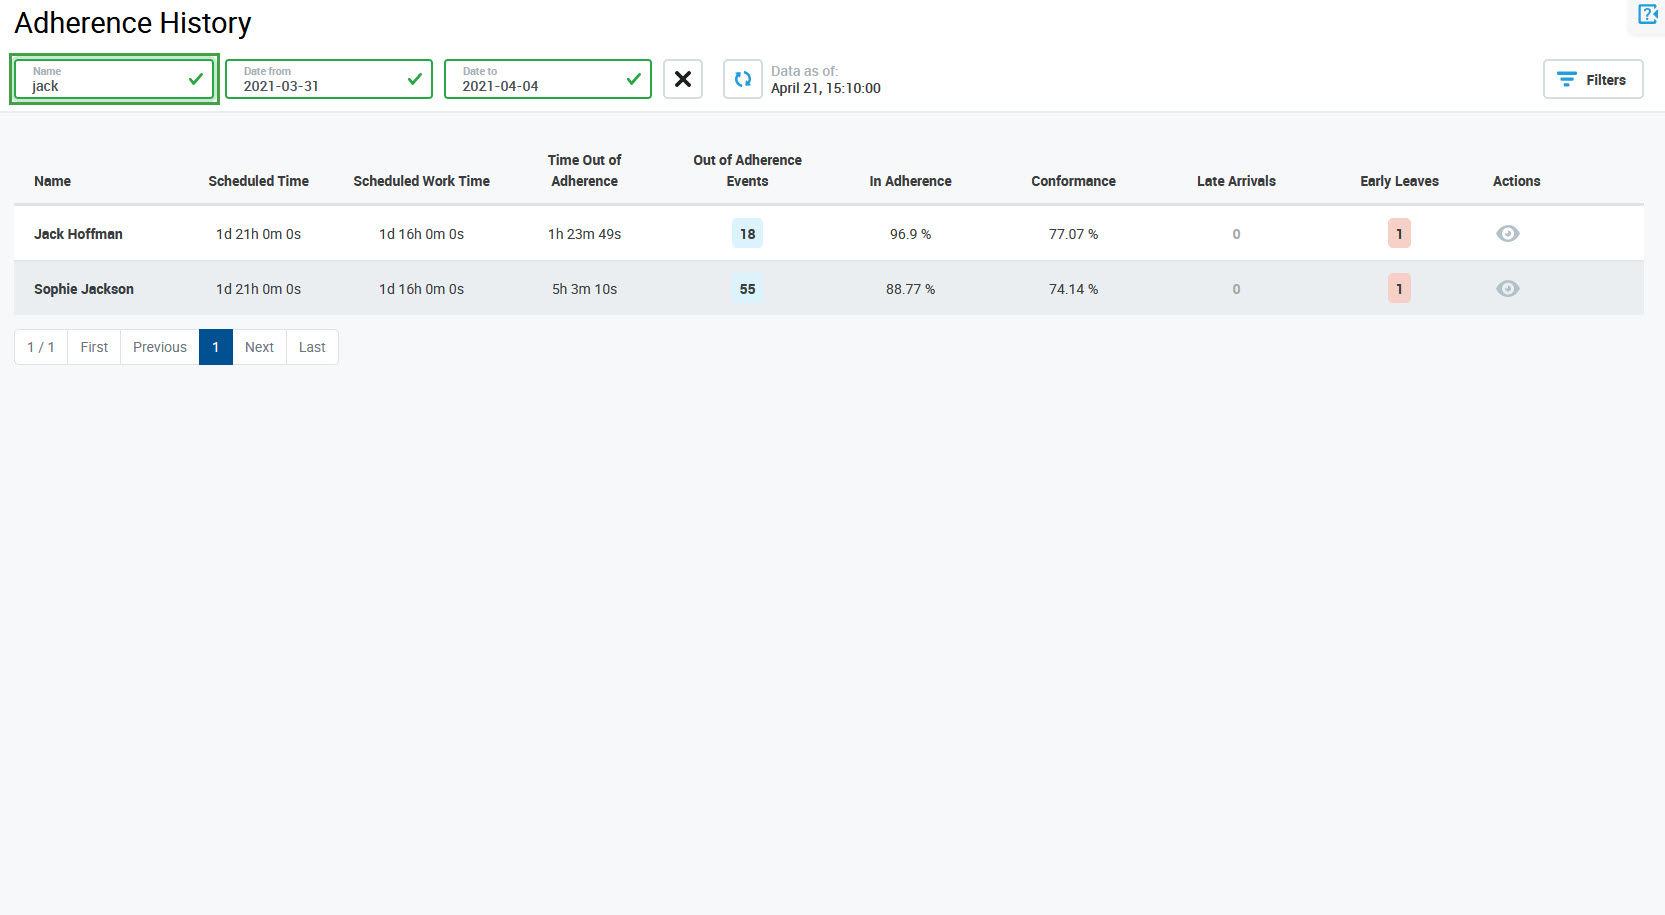
Filtering Based on a Person's Name
Enter the name of a person in the Name field to find the reports for this person. Search is not case-sensitive. Results will be dynamically displayed while entering the name. Click the Reset filter () button to remove the name.
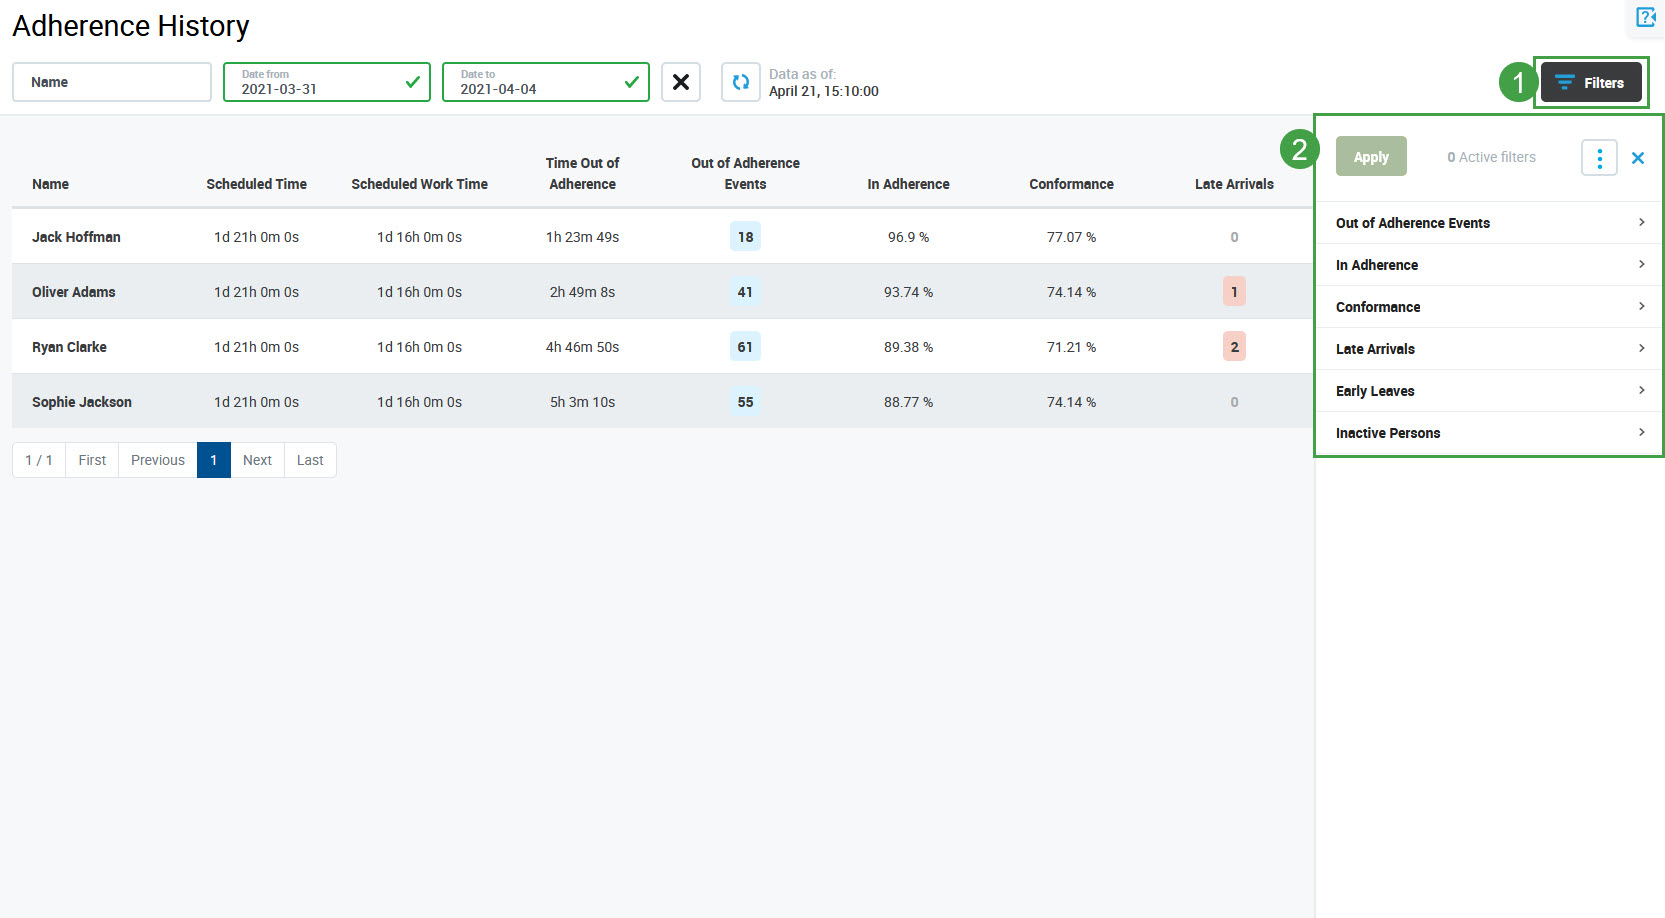
Filtering Based on Criteria (Filters)
To filter reports based on configurable criteria, click on the Filters button in the top right corner of the screen. The filters pane will display.
Click the individual tabs to expand them and to display the following filtering criteria:
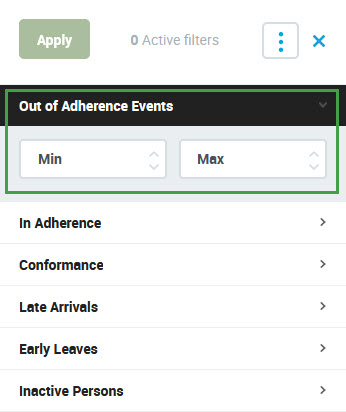
Out of Adherence Events – displays only people with the defined number of events, provide a min and/or max value
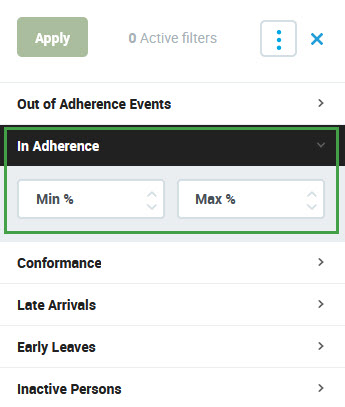
In Adherence – displays only people with the defined value, provide a min and/or max value (in percent)
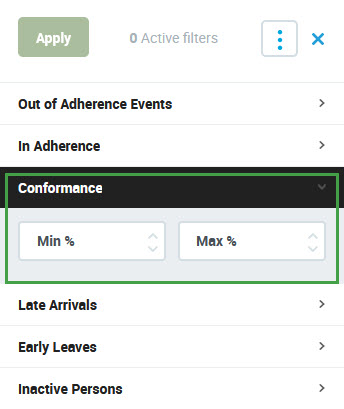
Conformance – displays only people with the defined value, provide a min and/or max value (in percent)
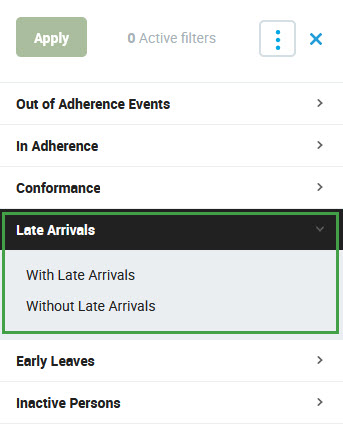
Late Arrivals – displays only people with or without late arrivals, select one option
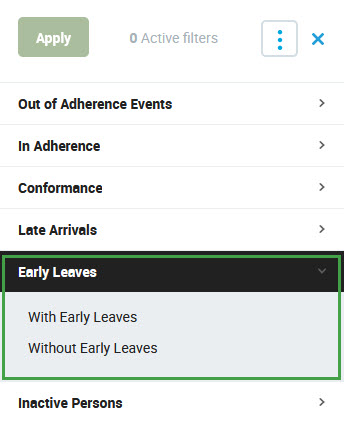
Early Leaves – displays only people with/without late arrivals, select one option
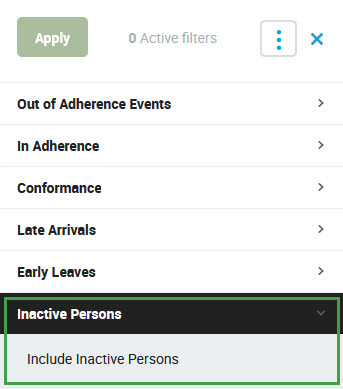
Inactive Persons – select if the reports of inactive people should be displayed
To read more about how to use filters, visit the page Using Filters.
JavaScript errors detected
Please note, these errors can depend on your browser setup.
If this problem persists, please contact our support.