
Overview
The Agent's activity overview report details how agents spend work time on calls, chats, meetings, breaks, and custom activities. It compares scheduled and actual hours per activity, showing if agents follow their plans daily or over a period. Filters include time, teams, agents, and activities. Useful for supervisors, team leaders, workforce managers, and operations managers to monitor performance and schedule adherence. They can spot issues like underuse, long breaks, or overtime and act on reliable data.
The following role is necessary in order to see the report in the menu:
-
ANALYTICS_ACTIVITY_HOURS_VIEW.
The following roles grant permissions to see the report:
-
ANALYTICS_AGENT– allows to see the report, including one's own data only -
ANALYTICS_SUPERVISOR/ANALYTICS_MANAGER– allows viewing data for all agents the user supervises (the user has the “Can Manage” option enabled on the team the agent belongs to, and the agent has that team set as “Main” in User Management). -
ANALYTICS_EXECUTIVE– allows viewing data for all agents.
Interactive Guide
Displaying Agent's Activity Overview Report
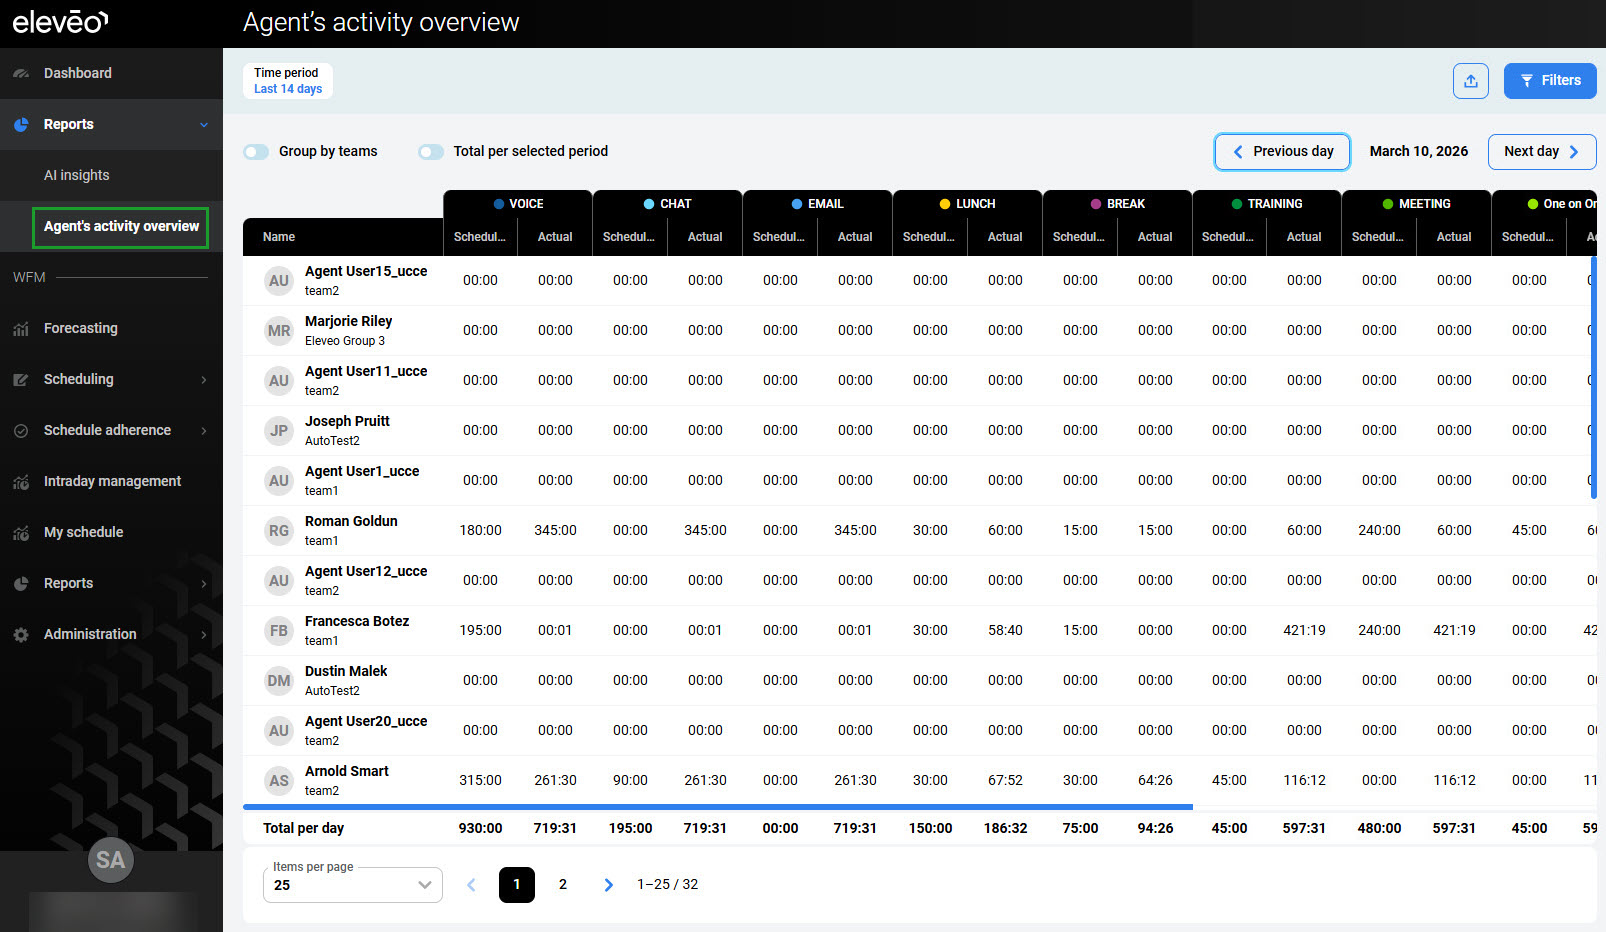
To display the Agent's activity overview report, expand the Reports module (outside the WFM section) within the navigation tree and click Agent's activity overview. The Agent’s activity overview screen will display. By default, a report for the last 14 days is generated, including data for all agents that the current user supervises.
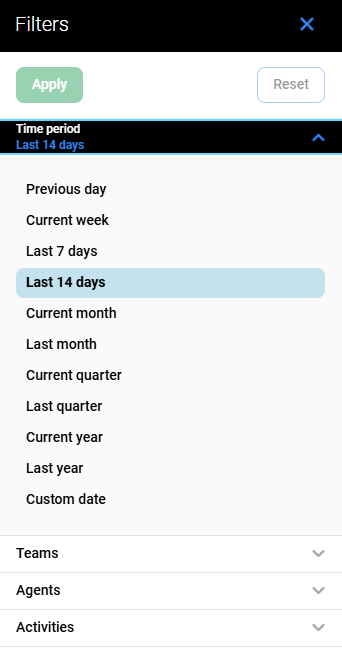
To modify the report, click the Filters button in the top right corner and use the Filters pane.
Click the tabs to expand them and display the following filters:
-
Time period – displays only data within the selected time range (if not selected, data from the last 14 days are displayed)
-
Teams – displays only data for people who are members of the selected teams or their subteams (if none are selected, displays data for all teams)
-
Agents – displays only data for the selected people (if none are selected, displays data for all people).
-
Activities – displays only data for the selected activities (if none are selected, displays data for all activities).
Click Apply to apply the filters and generate a report.
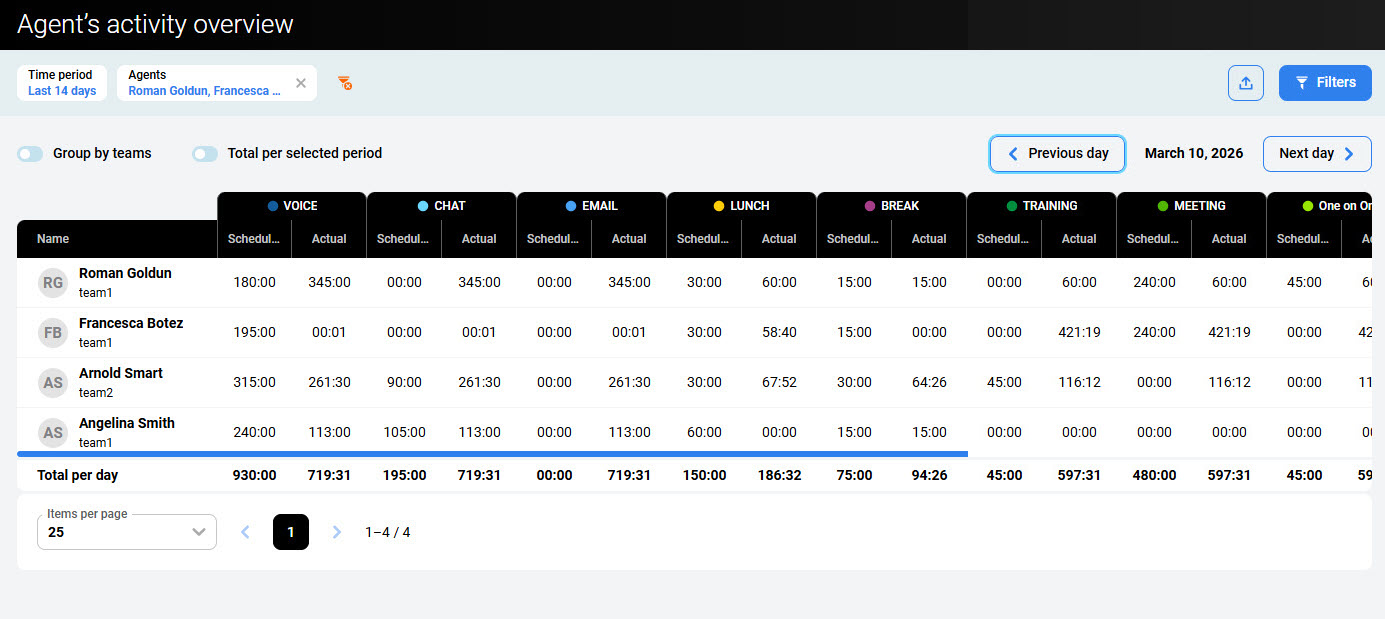
Active filters appear at the top of the screen. They can be removed individually or all at once by clicking the Remove icon on the right.
Changing the date
By default, the table displays data for the date shown in the top-right corner of the screen. It is possible to define a different date:
-
In the top right corner, locate the date selector between the Previous day and Next day buttons.
-
Do one of the following:
-
Click Previous day to move the report one day back.
-
Click Next day to move the report one day forward.
-
Click the date itself to open the calendar, then pick the specific date you want to display.
-
The table will refresh automatically to show the Agent's activity overview for the newly selected date.
Reading the Report
The Agent's activity overview report is displayed as a table. Each row represents a single agent for the selected date, and each column group shows how much time the agent spent in a specific activity type.
The table contains the following columns:
-
Name – Shows the agent’s name.
-
Activity columns – For each activity type (for example, VOICE, CHAT, EMAIL, MEETING, BREAK, LUNCH, and other custom activities), the report displays two sub‑columns:
-
Scheduled – The amount of time the agent was planned to spend in the given activity for the selected day.
-
Actual – The amount of time the agent actually spent in the given activity for the selected day.
-
Additional/custom activities are shown as separate column groups to the right and can be accessed by horizontal scrolling.
At the bottom of the table, the Total per day row summarizes the Scheduled and Actual time spent in each activity for all listed agents combined.
Use the pagination controls below the table to move between pages and the Items per page selector to change how many agents are displayed at once.
Additional Views
Additional toggle buttons at the top of the screen provide additional representation of data:
-
Group by teams – When enabled, the table groups agents under their respective teams. Team names appear as separate sections, making it easier to compare scheduled and actual agents' activity overview across different teams. When disabled, all agents are listed in a single, flat list regardless of team.
-
Total per selected period – When enabled, the Scheduled and Actual values in the table represent the sum of the agent's activity overview over the entire selected time period (for example, the whole current month), instead of showing data only for the single date displayed in the top‑right corner. This lets you review aggregated totals for the whole reporting period.
Exporting Data
To export the report as a CSV file, click the Export button and select Export CSV. Only the time period filter is applied to exported data. Other filters, even if applied, are ignored.
