Review Volume Report
The Review Volume report provides an overview of the number of reviews performed during the selected period of time. The report presents the total number of reviews, as well as planned, in progress and finished reviews separately. It is also possible to display the volume of reviews performed using a different scale - for the year, quarter, month, week or day. This report is commonly used by contact center managers to analyze the review volume, as well as the completion rate.
Setting Up a Report
The report allows the user to select teams, reviewers and questionnaires, to display the number of reviews (planned, in progress, finished) during the selected period of time.
A user will see a different data set, depending on the users' specific permissions:
Reports - View All – all data on the report
Reports - View Assigned Teams – only data for the assigned teams
Reports - View Myself – only reviews revealed to him/her or self reviews
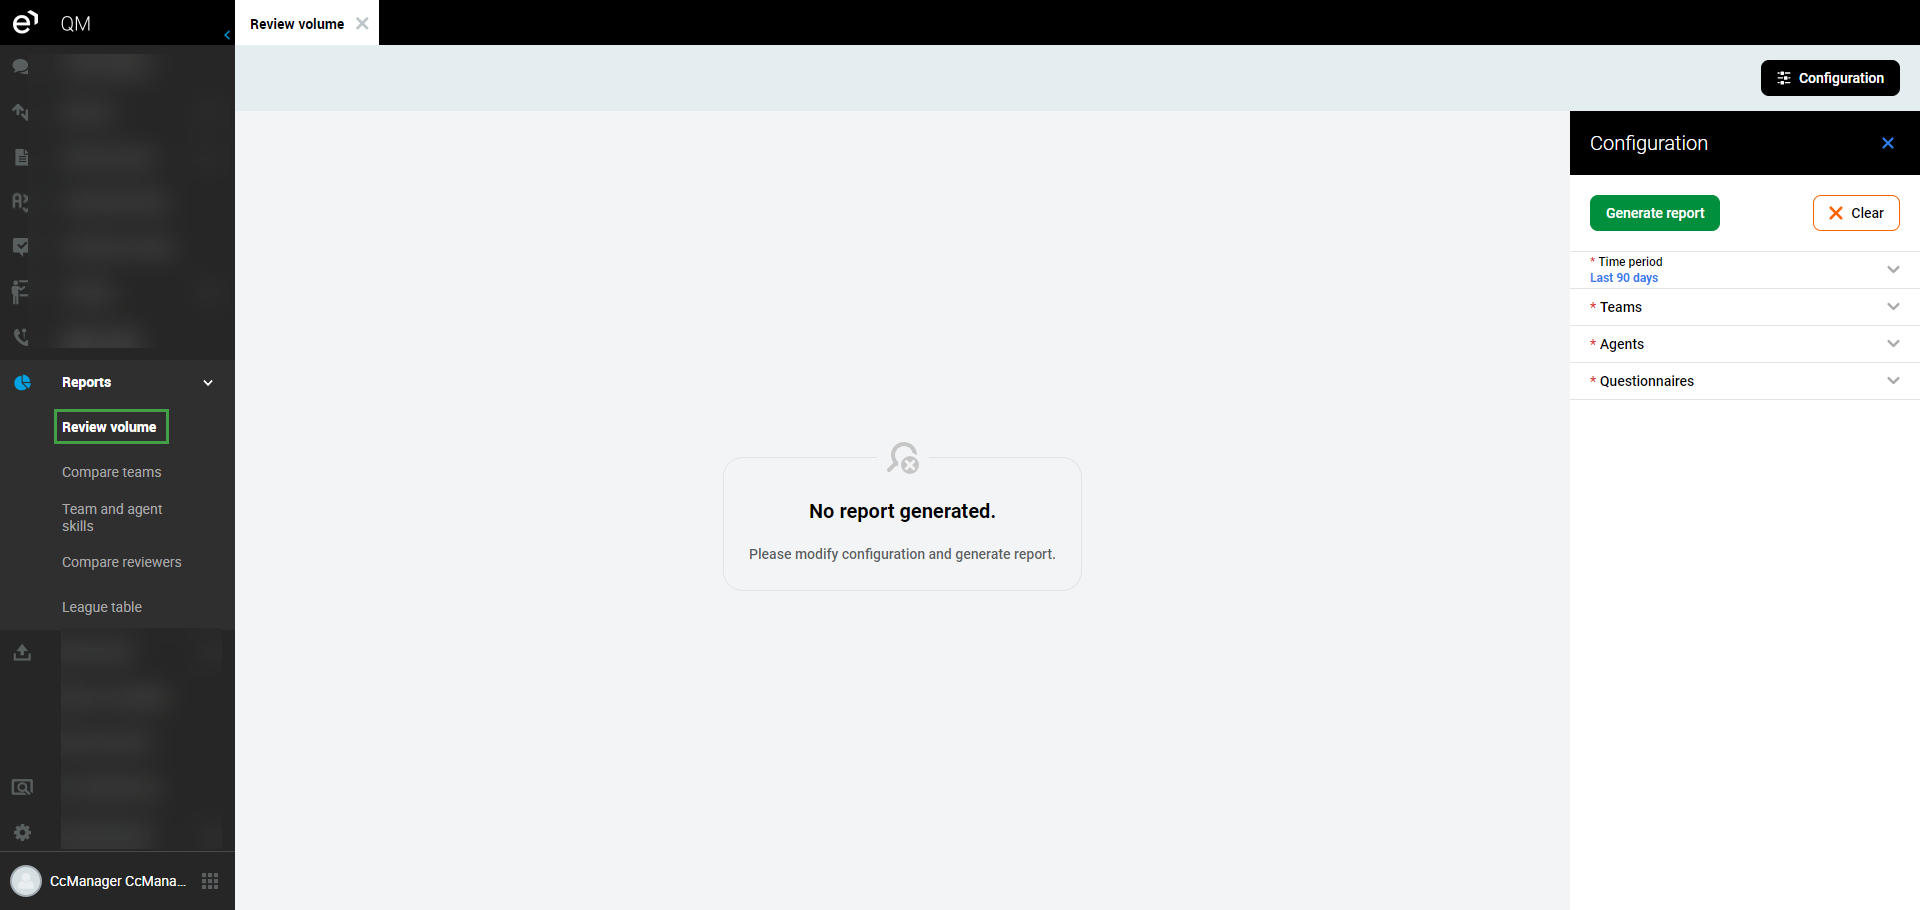
Select Reports > Review Volume from the left-hand menu. The Review Volume screen will open.
Follow the steps to set up the Review Volume report:
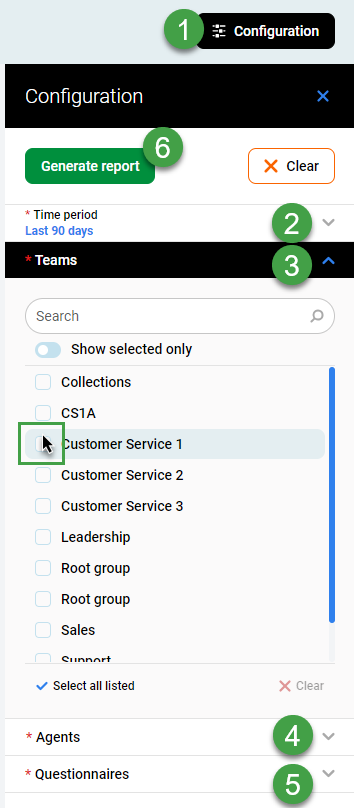
Click the Configuration button to get started. A detail pane will display.
Select the Time period (mandatory).
Select a team/teams from the Teams menu (mandatory).
Select Agents to include from the Agents menu - options available depend on the previous selection (mandatory).
Select a questionnaire from the Questionnaires menu (mandatory).
Click Generate Report to view the results, or Clear to start again.
How does Time period affect what is displayed?
Period To as defined in the Review criteria is used as the decisive date when a Review score is shown in the report/chart.
However:
For Reviews created by the Review Scheduler, then Period To as defined in the Review criteria is used as the decisive date when a Review score is shown in the report/chart.
For Reviews created directly from the Conversation Explorer the date when the conversation happened is used as the decisive date when a Review score is shown in the report/chart.
Note that you can show or reveal the full list of available choice by toggling the ‘Show selected only’ option.
The Review Volume report will display the full year by default). Switch to a weekly or monthly view if required.
Note that after selecting a team (or teams), only individuals assigned to this team(s) are available for selection.
By default, the scale is set to 'YEAR'. This means that a report displays the volume over a year, as defined by the selected Start date and End date.
Example
The selected time range is:
Start date: 2015-09-07
End date: 2018-09-30
The scale is set to 'YEAR'. The bars visible on the reports represent the following periods:
from 2015-09-07 until the end of the year 2015
the entire year of 2016
the entire year of 2017
from the beginning of the year 2018 until 2018-09-30
NOTE: The time used when calculating Reports corresponds to the timezone of the current user. Not necessarily the server timezone.
Period To as defined in the Review criteria is used as the decisive date when a Review score is shown in the report/chart.
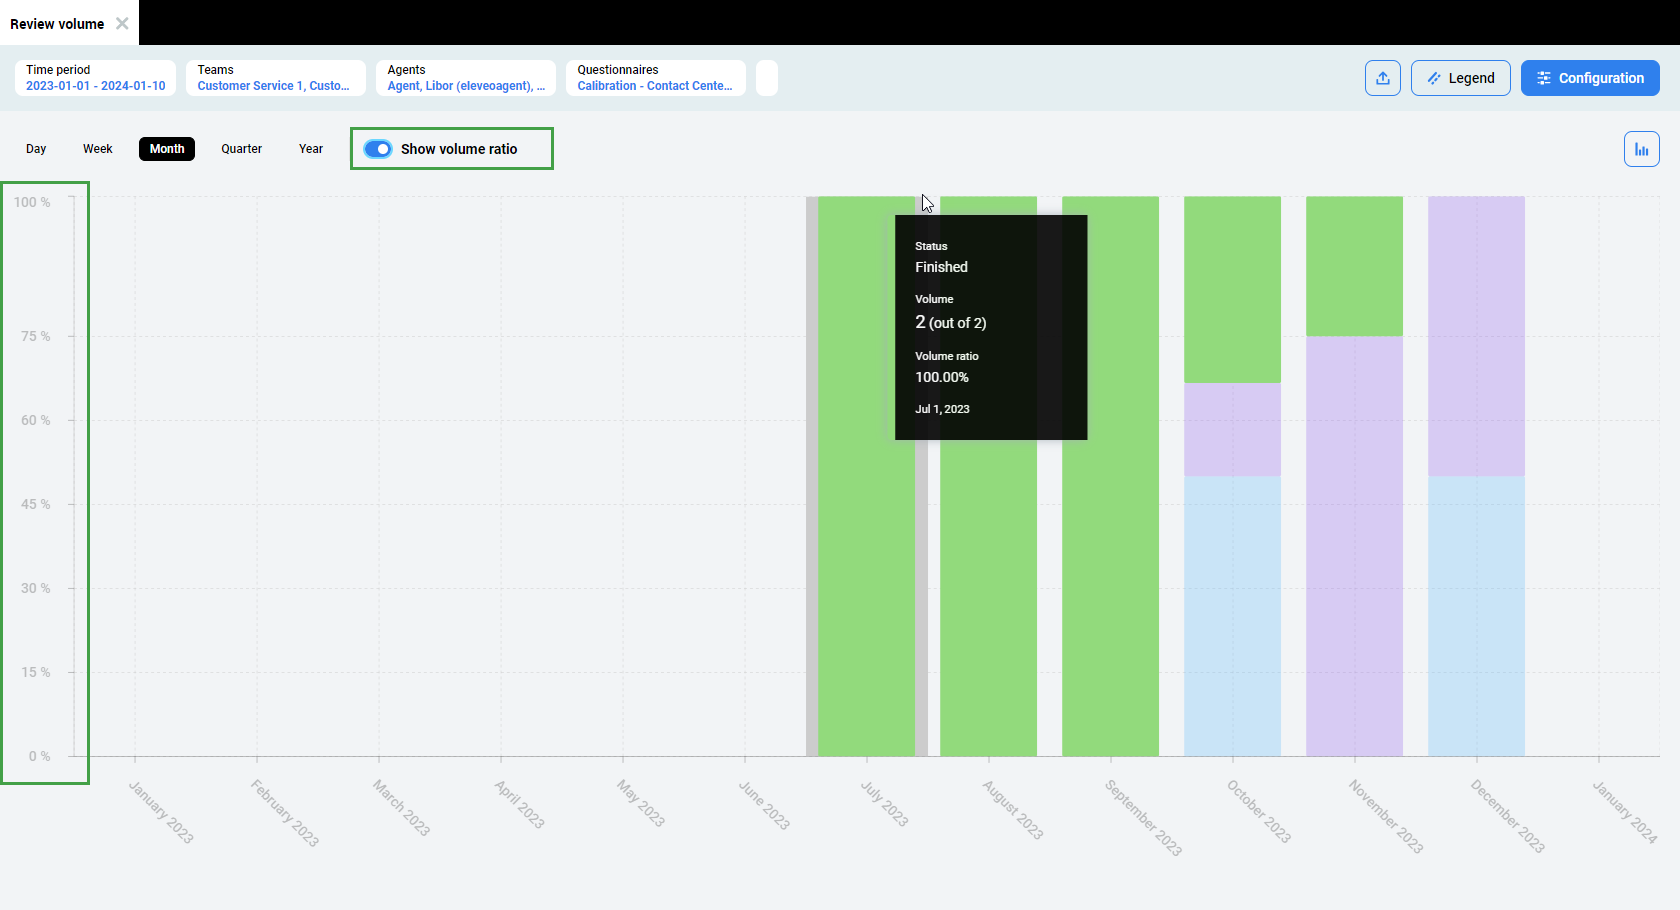
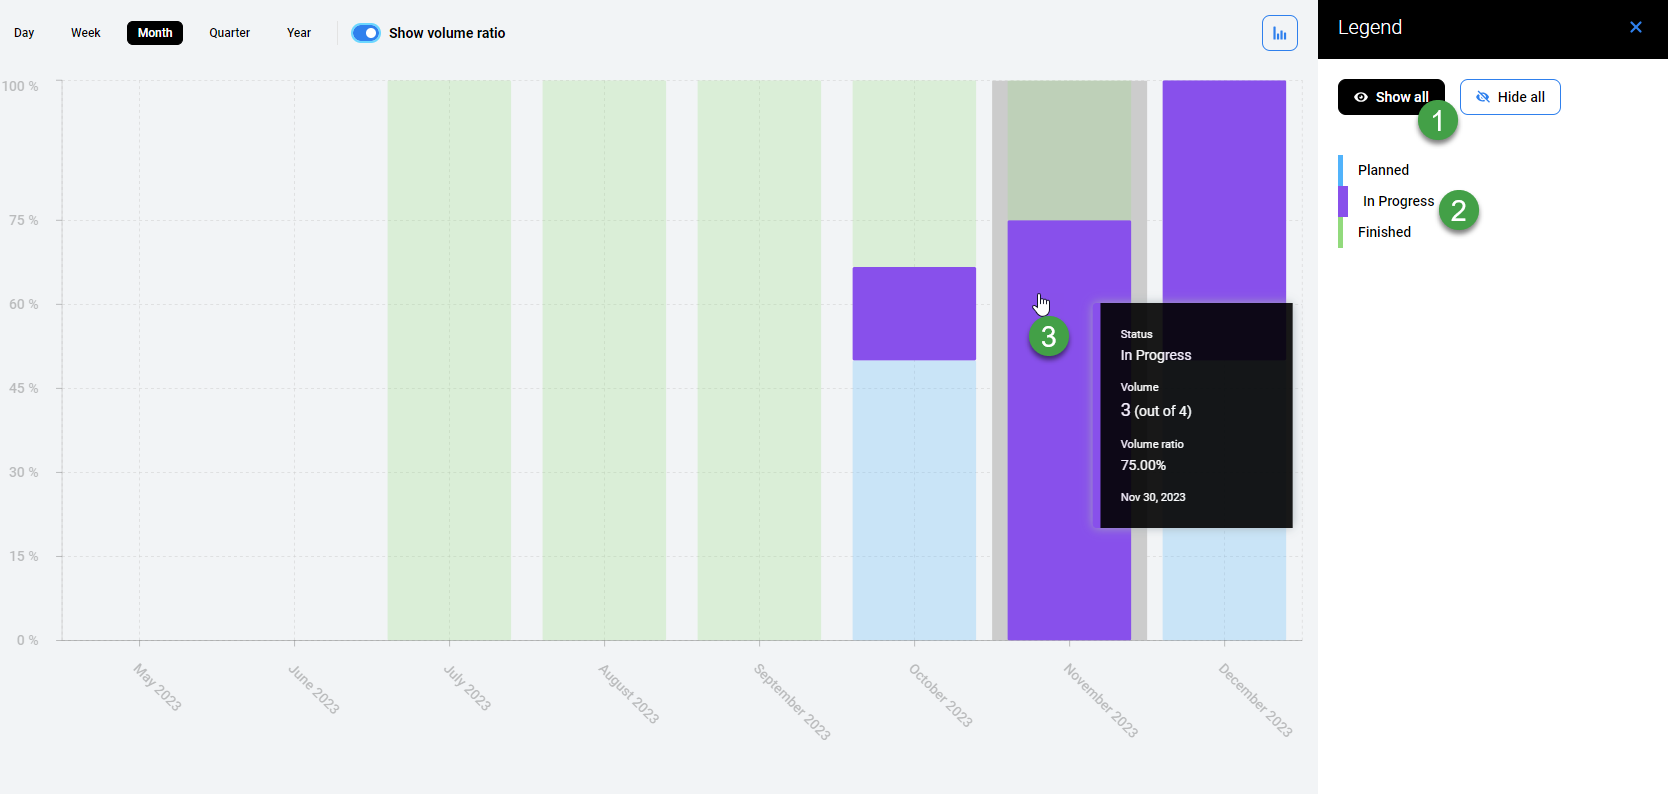
Hover the mouse cursor over the bars to view details. A tooltip with details for the selected item will appear.
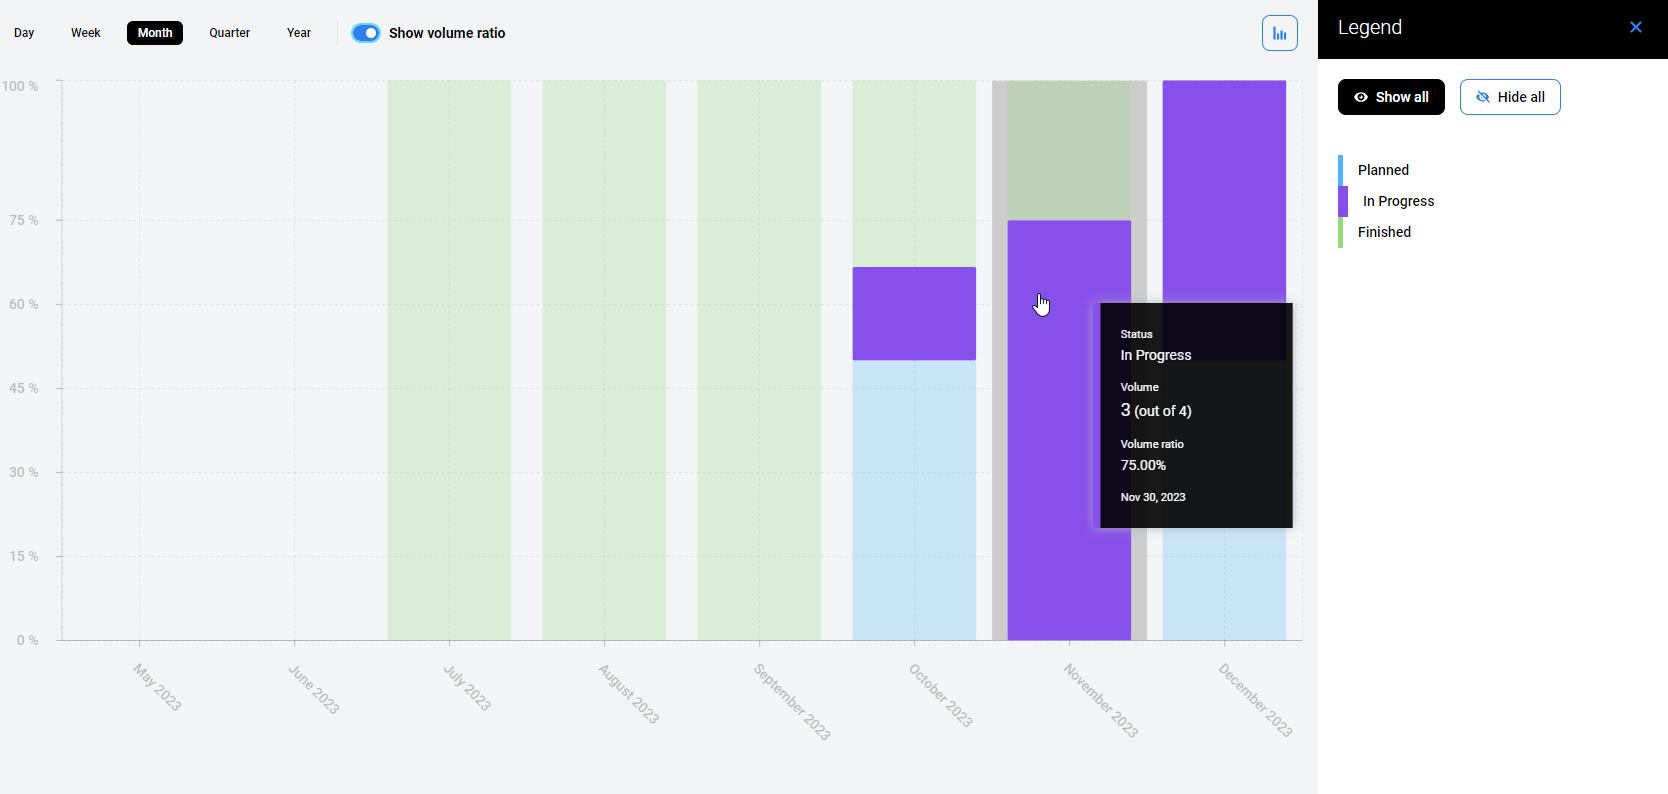
The tooltip contains the following information:
Status – status of reviews (planned, in progress, finished)
Volume – number of reviews with this status
Volume Ratio – number of reviews with this status expressed as a percentage of a total number of reviews
Date – Date of the review
Setting a Scale
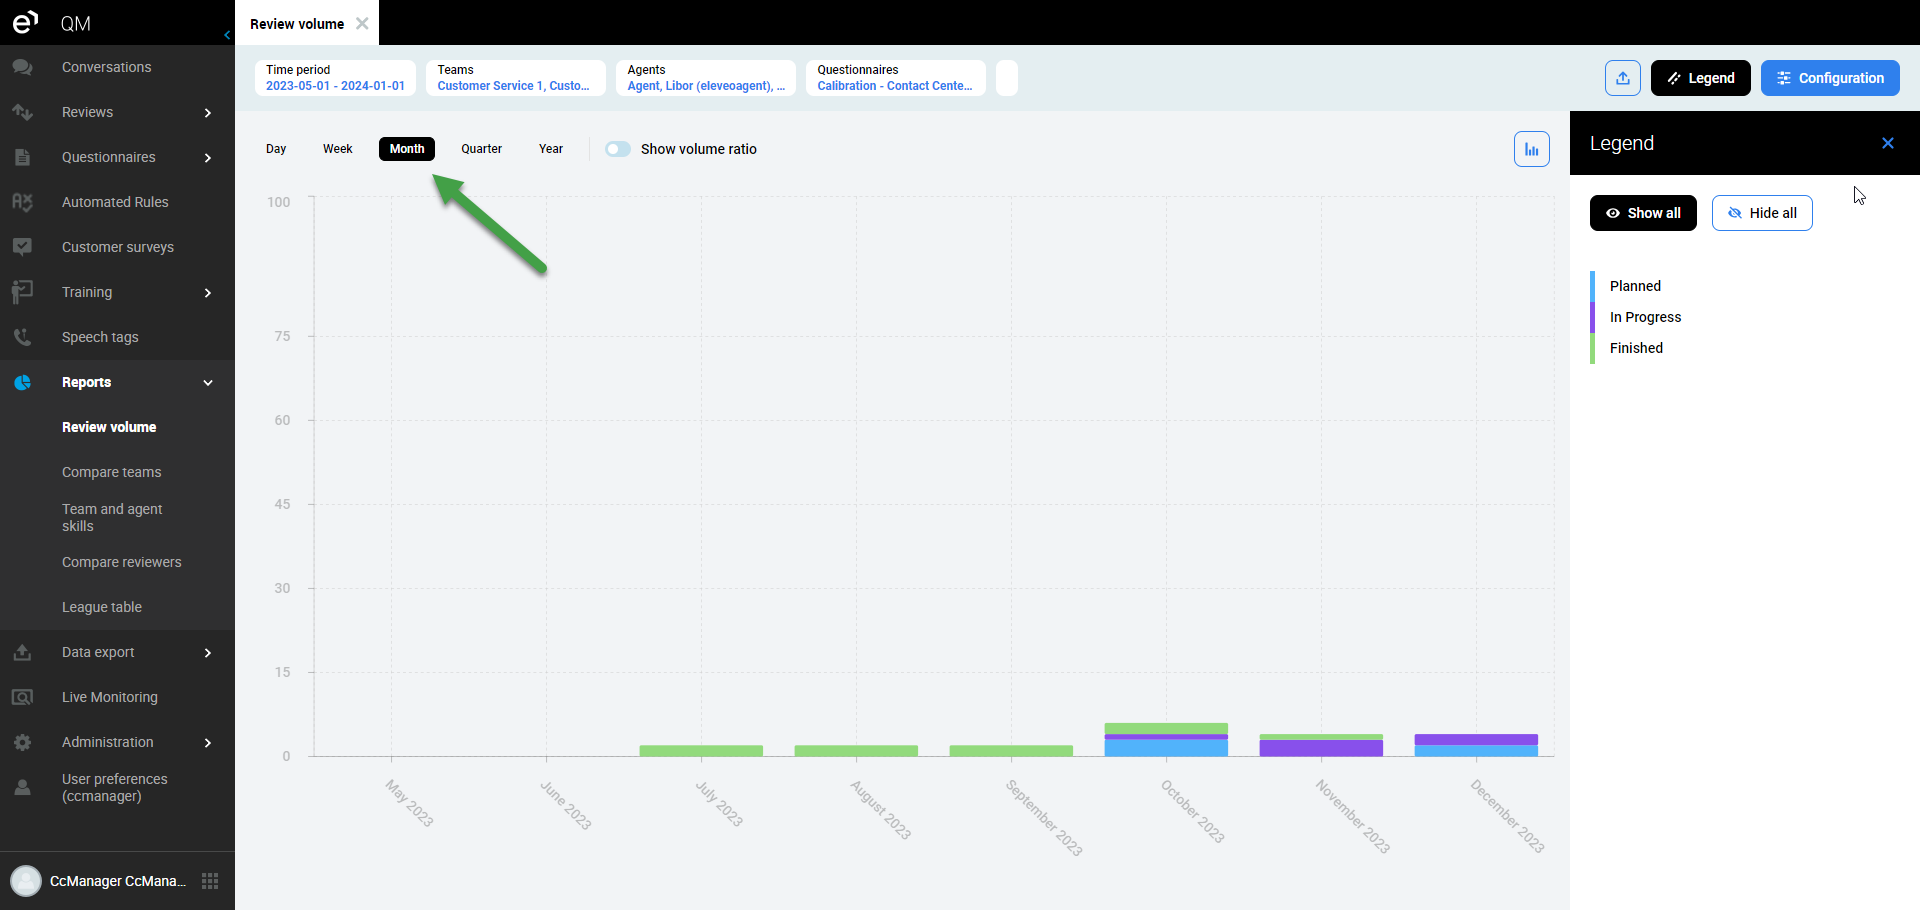
By default, the scale is set to 'YEAR'. The scale can be modified using the scale selector at the top of the report screen.

Set the scale to display
Click a different item (day, week, month, quarter) to view the volume for a shorter time period.
Note that to enhance visibility, only 40 bars can be displayed on a chart. If the selected time range and scale contains data for more than 40 items, a warning will display: 'The current scale is too granular to display the chart properly'. Only 40 items will display on the chart, counting backward from the End date. For example, if the selected scale is 'DAY', the last 40 days will display. If the selected scale is 'MONTH', the last 40 months will display.
Modify the scale or change the Start and/or End dates to limit the chart to 40 or less bars.
Switching Between Views
To display results as a volume ratio, use the Show volume ratio switcher at the top of the report screen.

The report bars will reflect the number of reviews during the selected period (day, week, month, quarter or year), expressed as a percentage of the number of reviews within the whole selected time range (from the Start date until the End date).
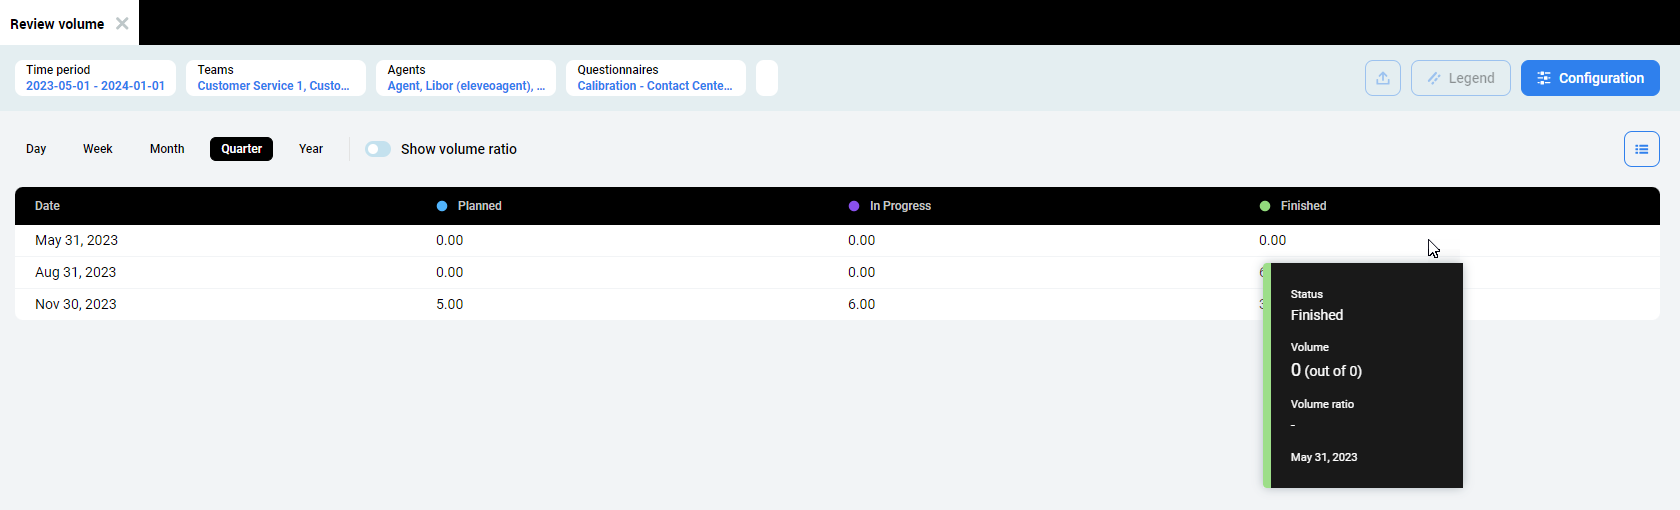
To switch between Chart and Table views, click on the Chart or Table button at the top right corner of the report screen.
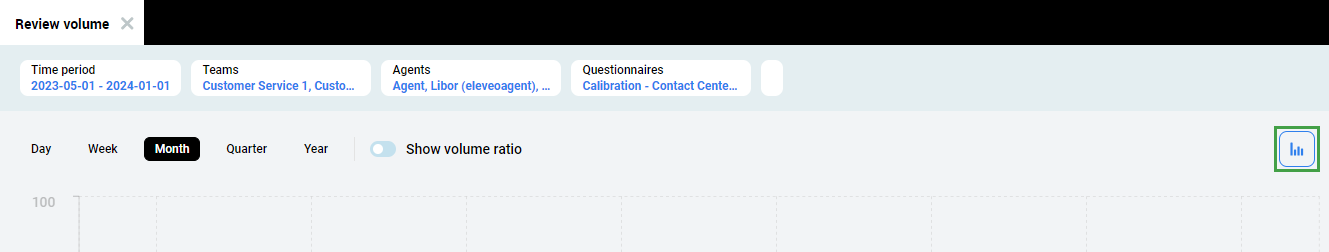
The Table view contains data used to generate the chart. The same data is exported to Excel when you export from this screen.
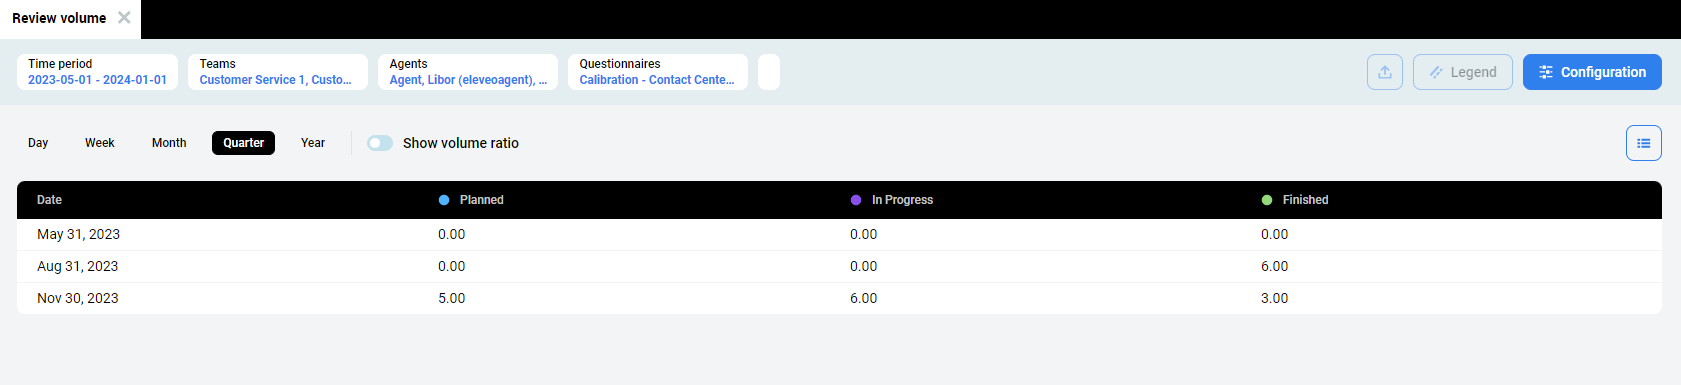
Hover the mouse cursor over the table to view details. A tooltip with details for the selected item will appear.
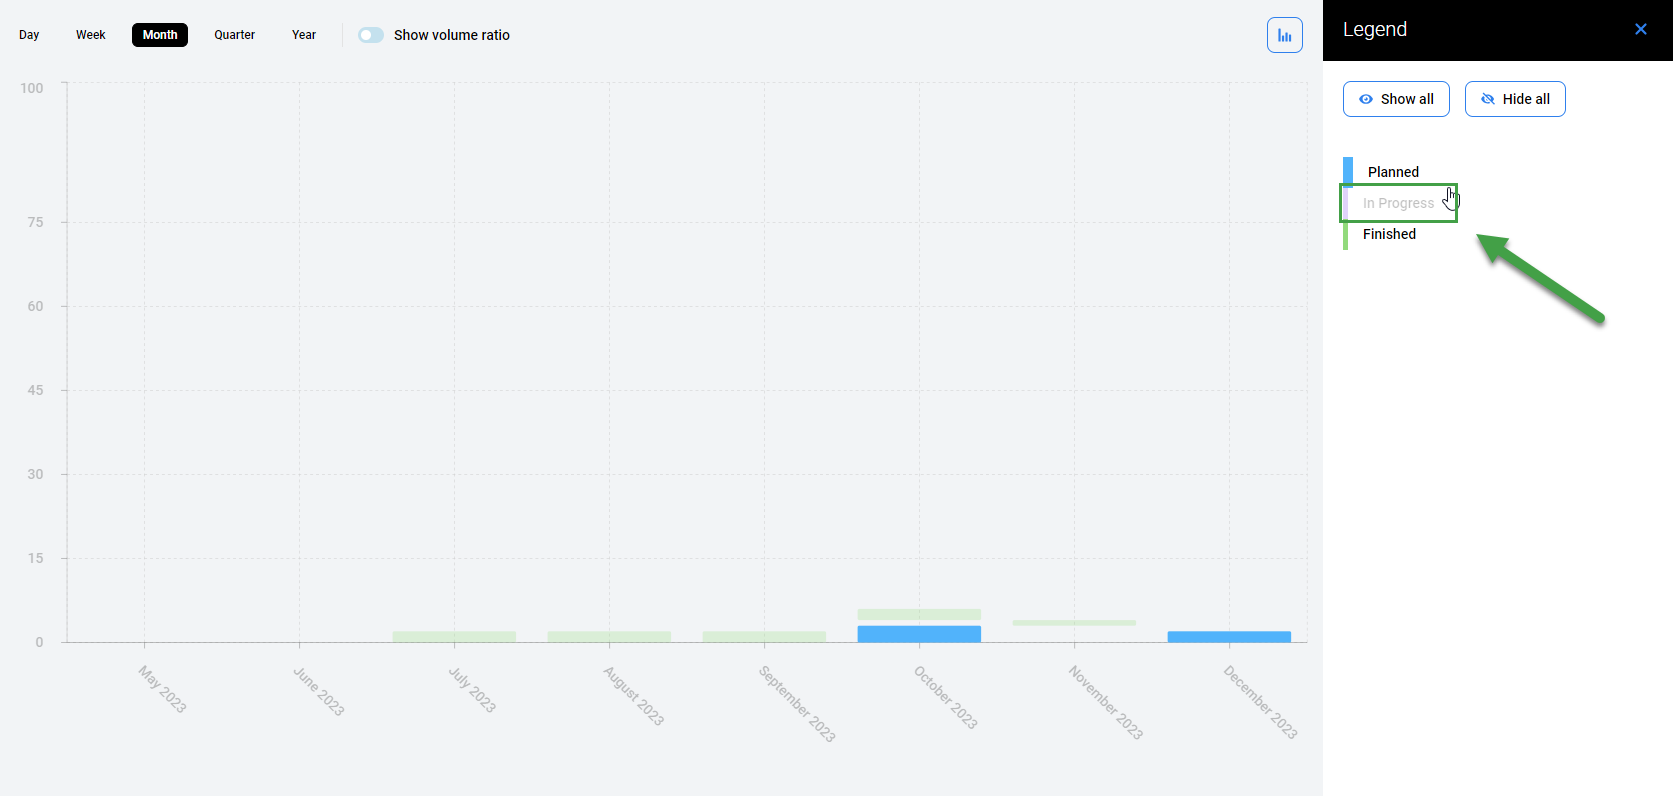
Selecting Individual Results
The legend initially shows all available reviews (Planned, In Progress and Finished). Click on a particular legend item to unselect it. The unselected items appear in gray on the legend and disappear from the chart. Click any grayed out item to select it again.
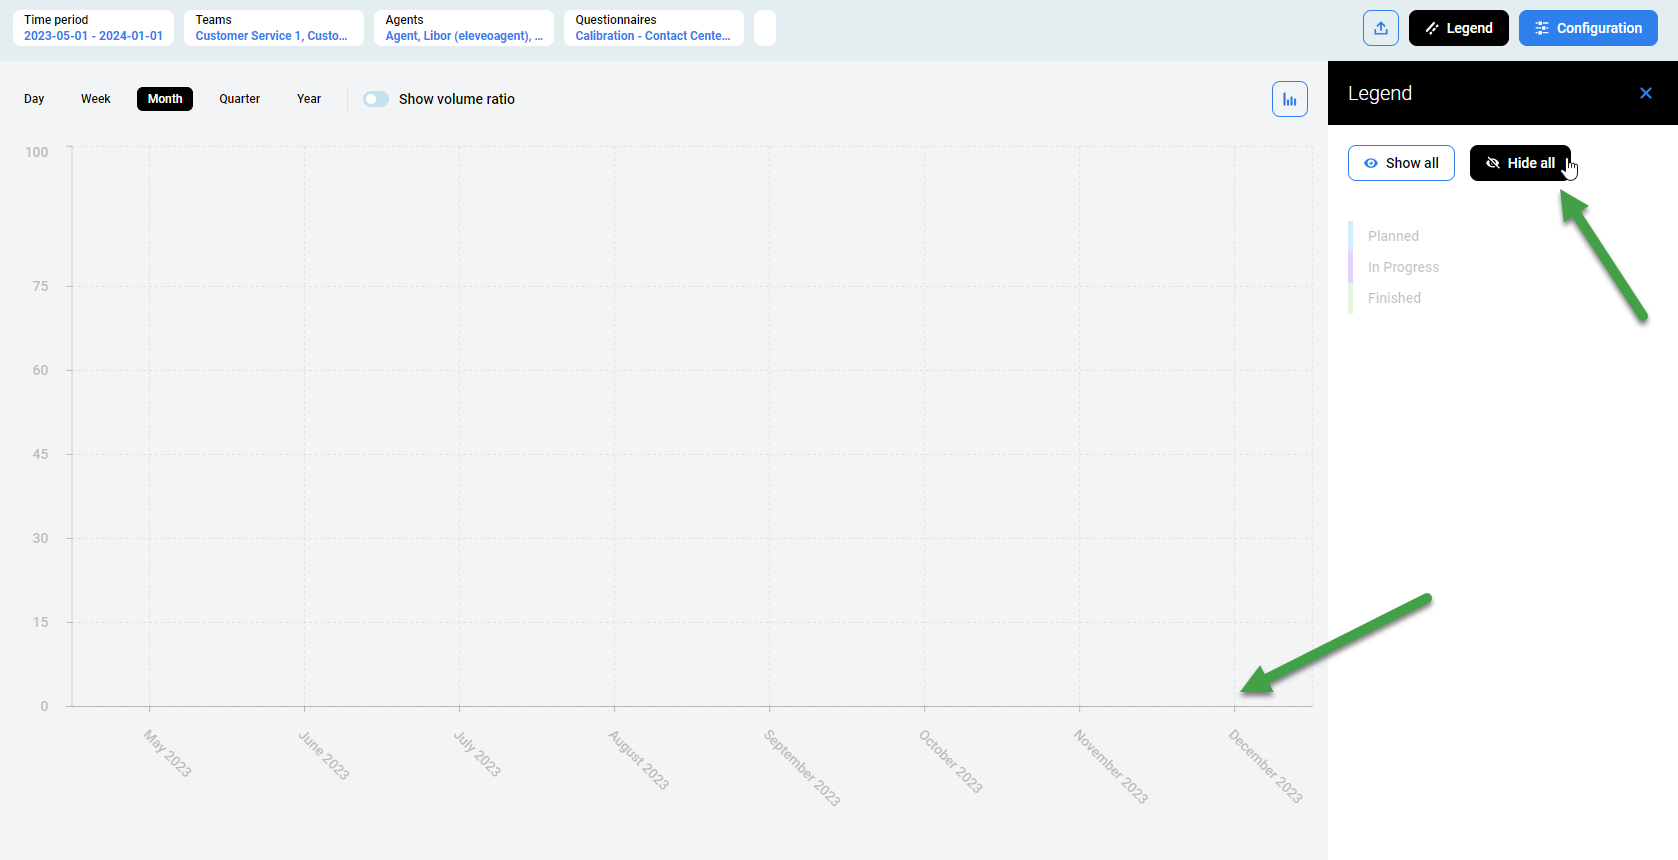
Click Hide all to gray out all items. Then click on the individual item or items to display on the chart. Click Show all to display all items again.
Another way to display individual results is through the use of highlighting:
Ensure that the Show all option is selected.
Hover the mouse over the legend item that should be highlighted.
The bar representing the selected item will remain fully visible on the chart. The rest of the items will be less visible.
Exporting Data
To export the report as an Excel spreadsheet, click the Export button.

A notification about the planned download will display, browser dependent.
The exported file contains all of the currently displayed data with the selected scale applied.
The time displayed corresponds to the timezone of the current user. Not necessarily the server timezone.
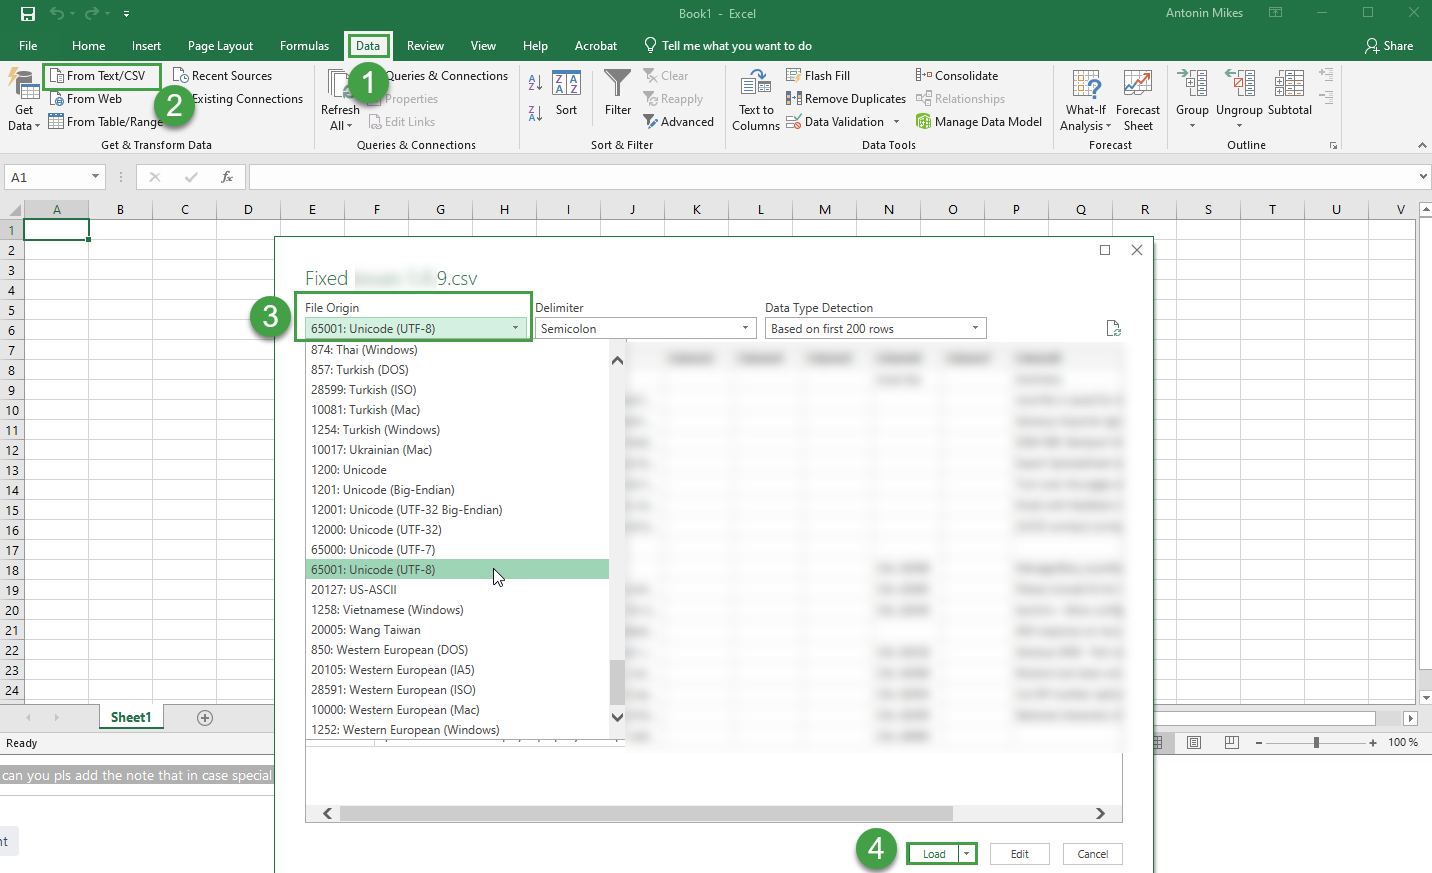
If you use international characters in your reports these special letters/characters may not display properly in MS Excel. If letters or characters do not display as expected please switch encoding in Excel to UTF. To do this open a new excel file and go to Data → Import from text.
Open Microsoft Excel
Go to the Data Tab
Click on the From Text/CSV icon.
Navigate to the location of the file that you want to import and import it.
Select the file type that best describes your data from the File Origin dropdown menuSelect Unicode (UTF-8)
Click Load