League Table Report
The League Table report consists of data gathered from different teams, which has been combined and sorted to show where agents stand in rankings. This kind of report is useful if agents are rewarded based on their quality scores in comparison to a defined target score.
Setting Up a Report
The League Table report is used to rank groups and agents from the highest score to the lowest score. Users can then identify and target which agents need additional training or coaching. The League Table is based on specified questionnaires. This allows users to rank agents according to quality, training or voice of the customer campaigns.
Select Reports > League Table from the left-hand menu. The League Table screen will open.
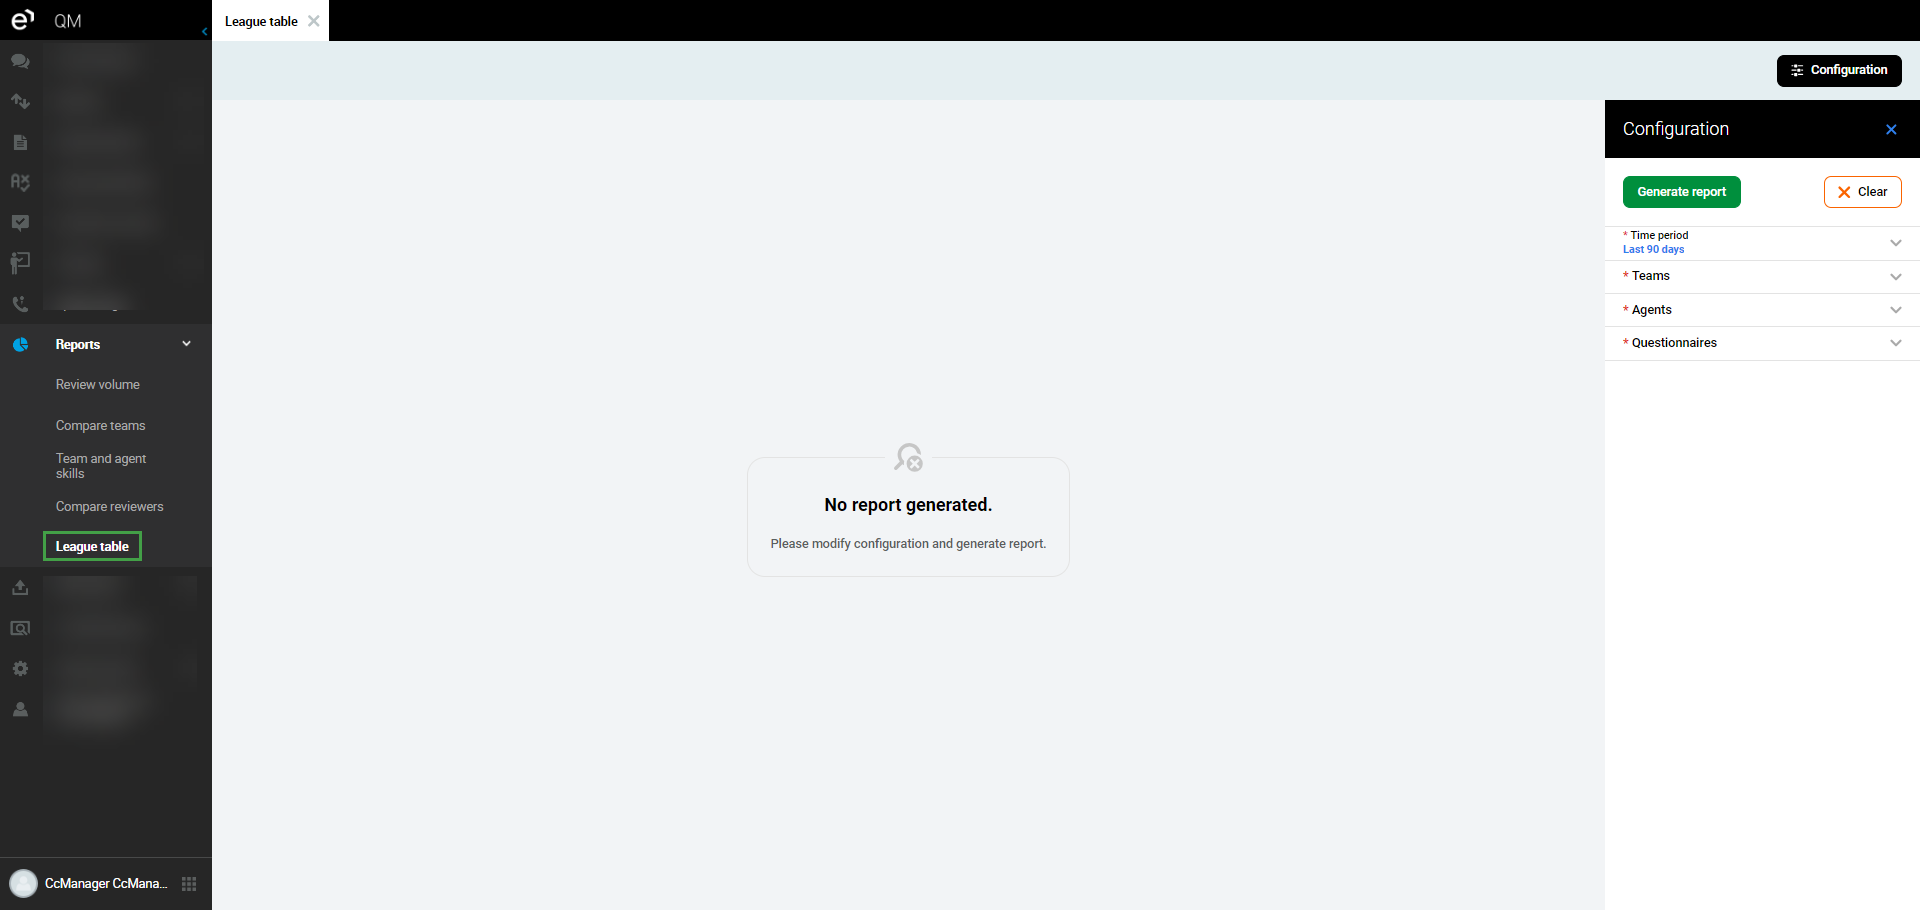
Follow the steps to set up the League table reports:
Select the Time period (mandatory).
Select one or more teams from the Teams drop-down menu (mandatory).
Select one or more agents from the Agents drop-down menu (mandatory).
Select one or more questionnaires from the Questionnaires drop-down menu (mandatory).
Click Generate report. The League Table report will display.
Use the Select all listed check-box to select all teams, all agents or all questionnaires. Then, use the Clear button to unselect them all if necessary.
Selection of all fields is mandatory!
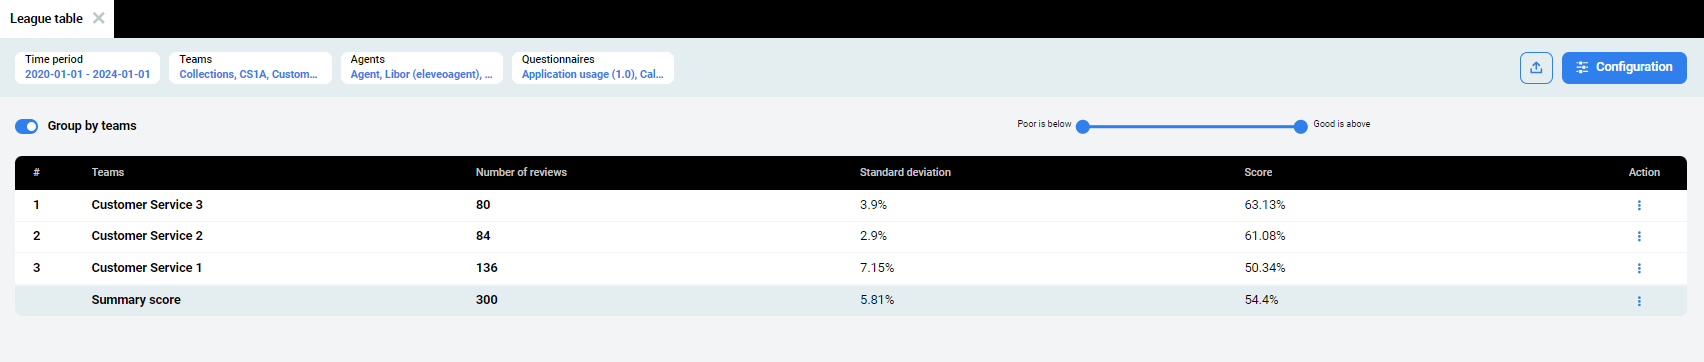
By default, the League Table report shows the results for the selected team or teams. The table contains the following data divided into the following columns:
Teams – name of the team
Number of reviews – number of reviews performed for the team using the selected questionnaire(s) during the defined period of time
Standard deviation – standard deviation calculated for the received score
Score – average score received by the team in the selected questionnaire(s) during the defined period of time
The results are sorted by the scores (descending). The bottom line of the table contains the Summary score values: the total number of reviews, the average standard deviation and the average score.
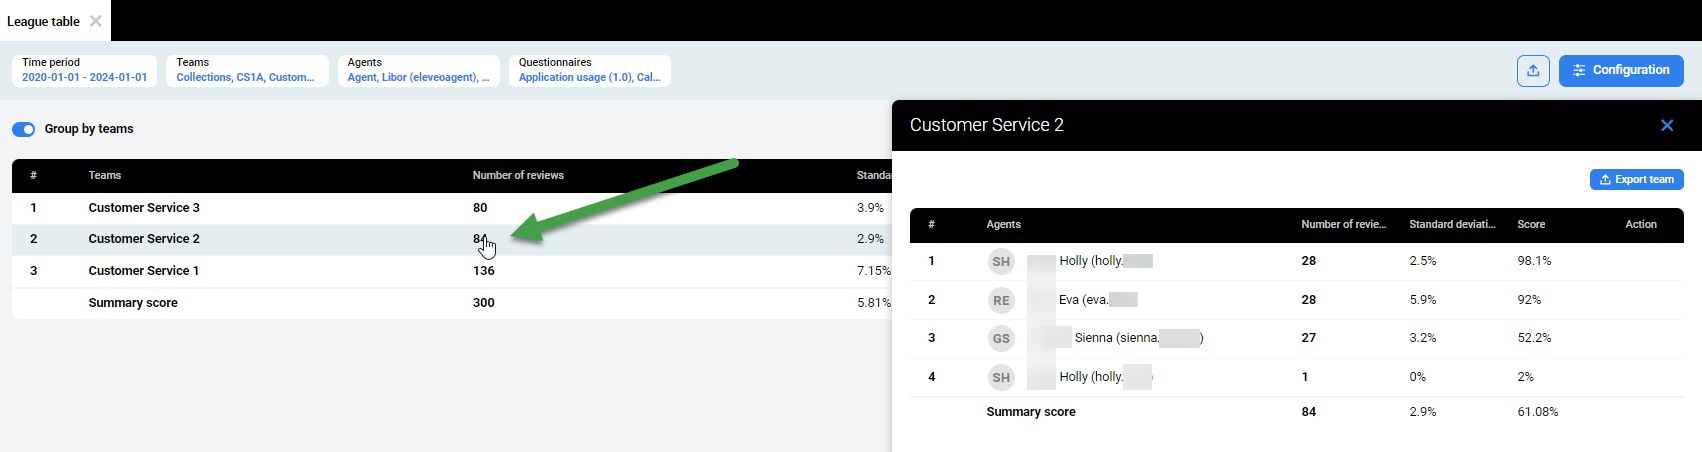
Click on the team's name to open an additional pane on the right side of the screen.

The pane contains detailed information about all agents from the selected team divided into the following columns:
Agents – name of the agent
Number of Reviews – number of reviews performed for the agent and using the selected questionnaire(s) during the defined period of time
Standard Deviation – standard deviation calculated for the received score
Score – average score received by the agent in the selected questionnaire(s) during the defined period of time
The results are sorted by the scores (descending). The bottom line of the table contains the Summary score values: the total number of reviews, the average standard deviation and the average score.
It is possible that an agent may be listed twice in the table if questionnaires with two different scoring systems (points and percentage) were used for reviews.
More actions
To view more detailed information click on the three dots under Action. Select from of the available options.
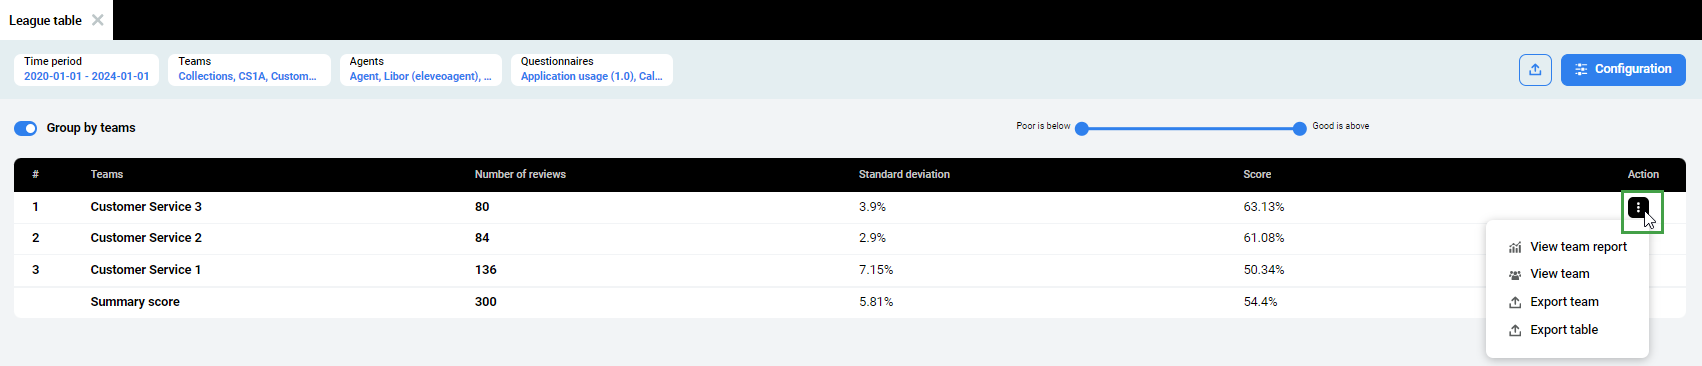
Options may vary based on the selection:
View agent report – Redirects to the Team and agent skills report
View team – Redirects to the Compare teams report
View team – Opens a details pane with additional information
Export team – Exports data for the current team
Export table – Exports data for the current table (all included data)
Switching Between Views
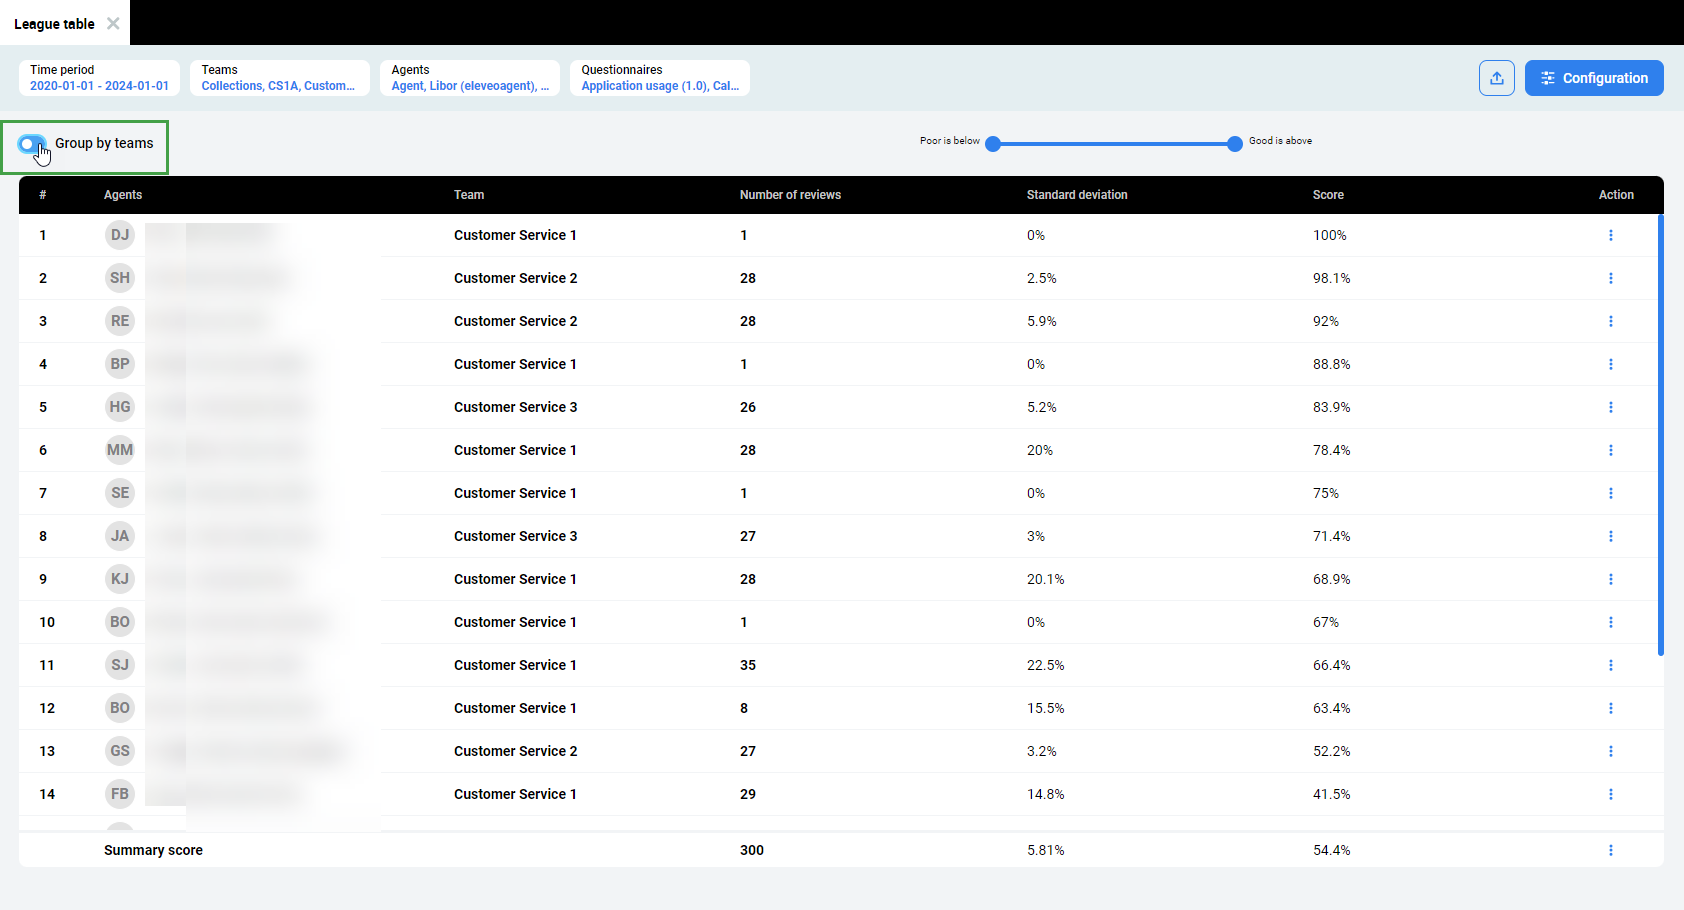
To switch between grouping the results by teams or by agents, use the Group by teams switch at the top left corner of the report screen.
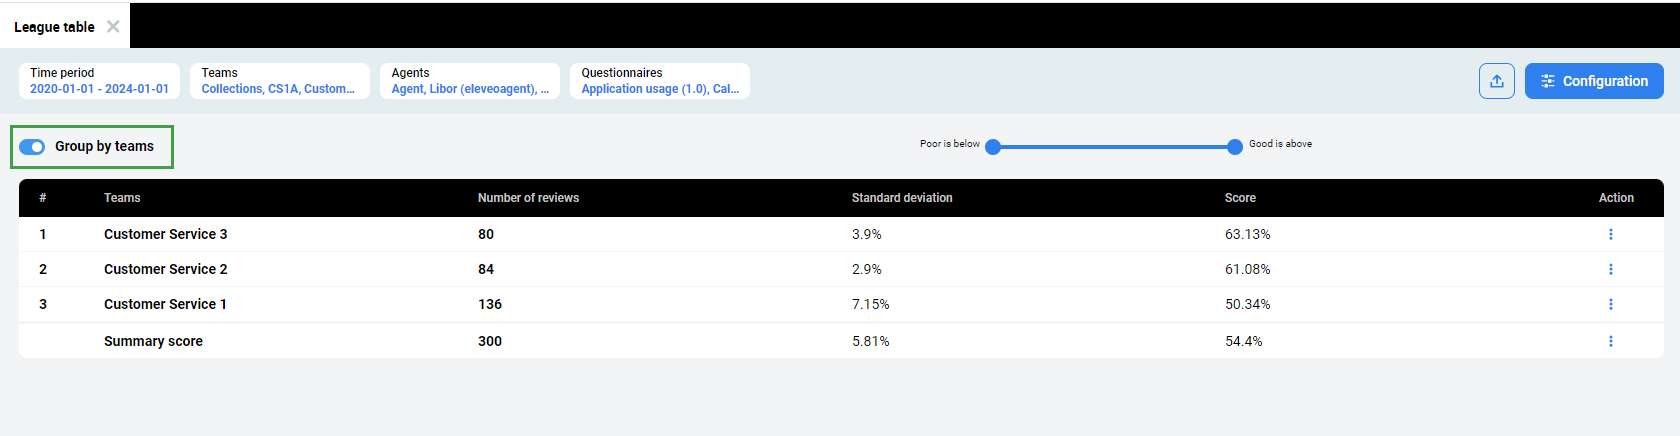
By default, the Group by teams view is switched on.
When the Group by teams view is switched off, the Agents column is added, so the table contains results for all agents from the selected teams. The results are not sorted by the scores.
Click on the agent's name to see details. The Team and Agent Skills report will open, showing the questionnaire results for the selected agent. Read more about how to use Team and Agent Skills report.
Click on the team's name to see details. The Compare Teams report will open, showing the questionnaire's results for the agents from the selected team. Read more about how to use Compare Teams report.
Click on the number of reviews to view details.
The Team and Agent Skills report will open, showing the questionnaires' results for the selected agent. Additionally, the questionnaires will display within the Configuration pane to the right of the report screen.
Read more about how to use Team and Agent Skills Report.
The transition from the League Table report to the Compare Teams report works when only one questionnaire is selected.
Marking Poor and Good Scores
Use the slide bar at the top of the table to define which scores are poor and which scores are good. By default no scores are poor (Poor is below 0%) and no scores are good (Good is above 100%).

Move the left slider to define a value under which the results are considered to be poor.

These scores will be indicated in the table with the color red.

Move the right slider to define a value above which the results are considered to be good.
These scores will be indicated in the table with the color green.
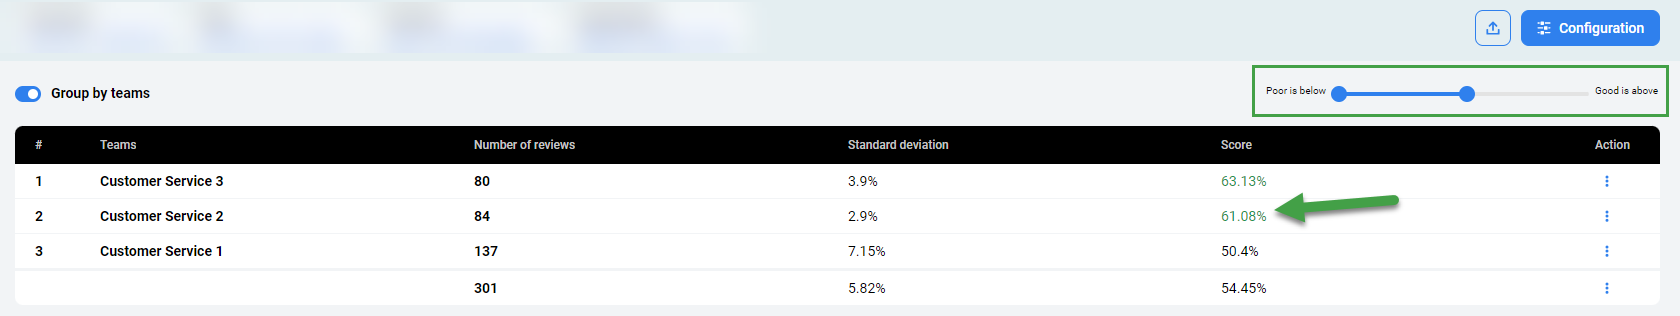
It is possible to set Poor is below and Good is above values at the same time. Relevant scores will be marked with red or green color.
The setting is applied to all views.
Exporting Data
There are two ways of exporting data from the table:
exporting the whole report (all results)
exporting the report for the selected team (results of the selected team)
All Results
To export the whole report as an Excel spreadsheet, click the Export button.

The exported file contains all results for the selected period of time.
Results for the Team
To export results for the selected team, click on the number of reviews to open an additional pane on the right side of the screen, then click on the Export team button.
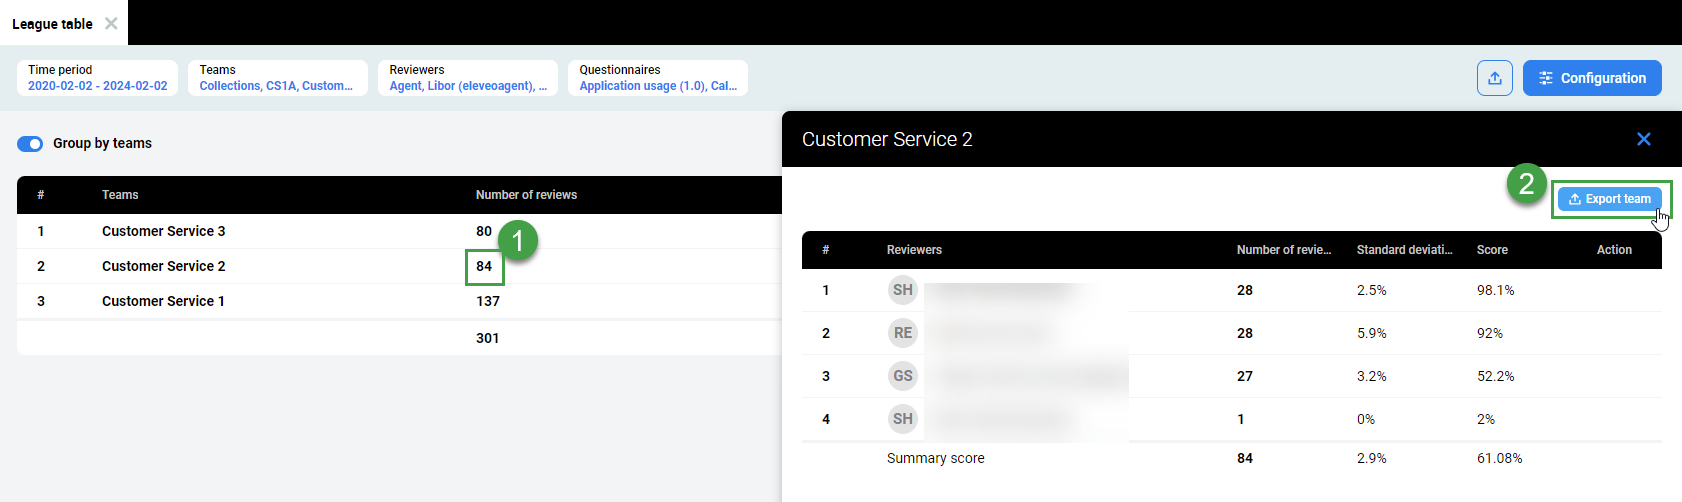
The exported file contains results for agents from the selected team for the selected period of time.
The time displayed corresponds to the timezone of the current user. Not necessarily the server timezone.
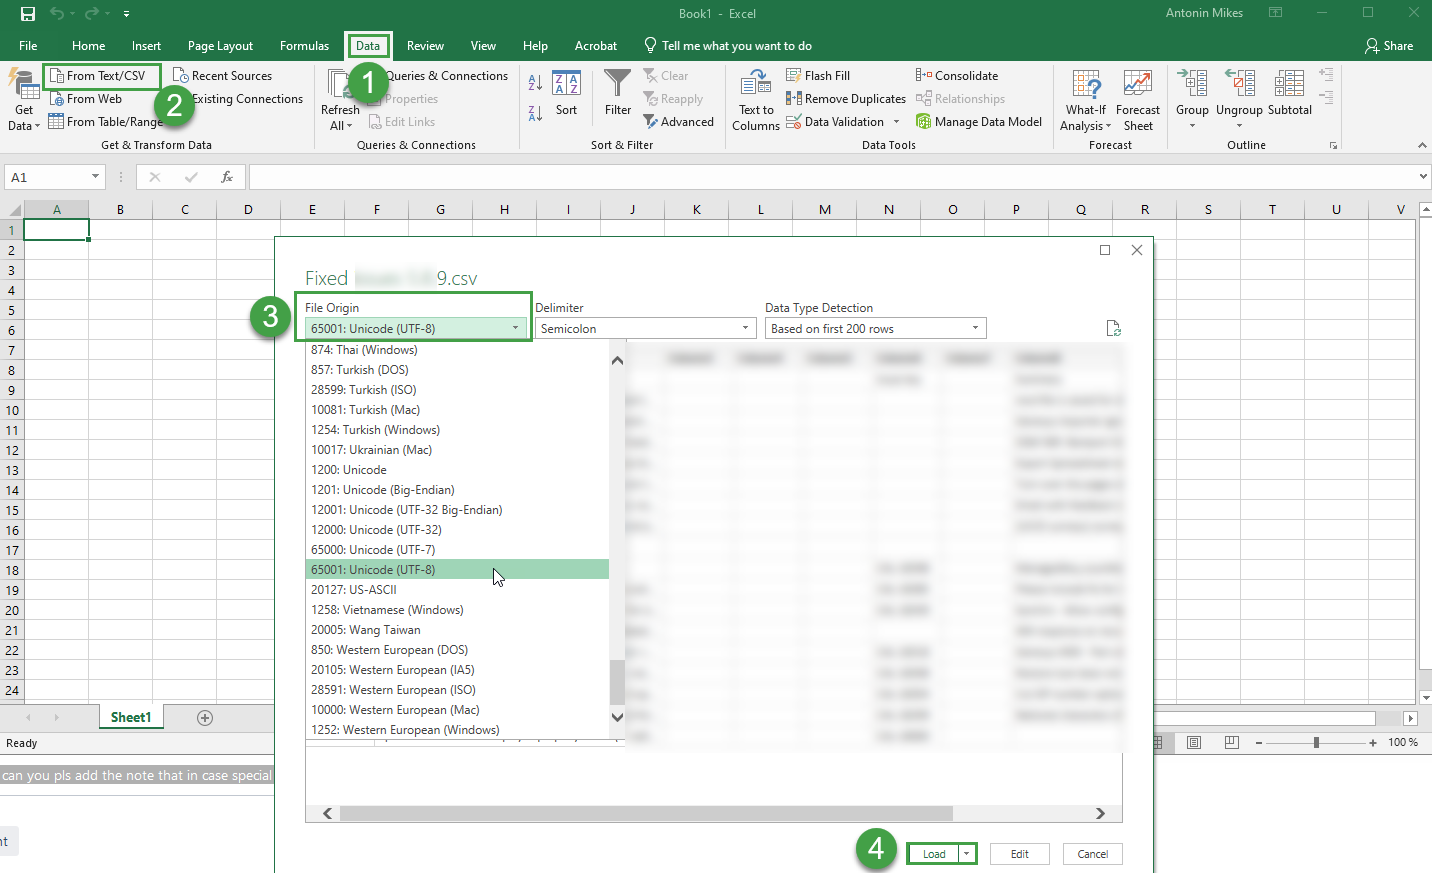
If you use international characters in your reports these special letters/characters may not display properly in MS Excel. If letters or characters do not display as expected, please switch encoding in Excel to UTF. To do this open a new excel file and go to Data → Import from the text.
Open Microsoft Excel
Go to the Data Tab
Click on the From Text/CSV icon.
Navigate to the location of the file that you want to import and import it.
Select the file type that best describes your data from the File Origin dropdown menuSelect Unicode (UTF-8)
Click Load