Intraday Management
Intraday Management is a set of charts based on live contact center data. Intraday Management imports data from the contact center every 15 minutes, compares that data with the original forecast, and then calculates estimated trend data (re-forecasted) for the next 13 hours. Results are displayed directly within the Eleveo application. Having this up-to-date data enables managers to make informed decisions about staffing levels and adjust the staffing schedule as required.
For Intraday Management functionality to work properly, configure the cron job for importing historical data to run every 15 minutes:
for Webex Contact Center or Zoom Contact Center integrations in ETL Management UI
for UCCE and UCCX Data Importers in Rachner configuration (Scheduler cron expression for historical data)
Note:
Only users assigned the
WFM_VIEW_INTRADAYandWFM_VIEW_INTRADAY_EVENTSroles can see the Intraday Management tab in the navigation tree. The roleWFM_VIEW_INTRADAY_NOTIFICATIONshould be assigned to see notifications settings and theWFM_EDIT_INTRADAY_NOTIFICATIONrole should be assigned to users who edit notification settings. Read more about Roles.The data importer imports data from the contact center every 15 minutes. The charts update within the user interface at the same interval. The import schedule cannot be modified.
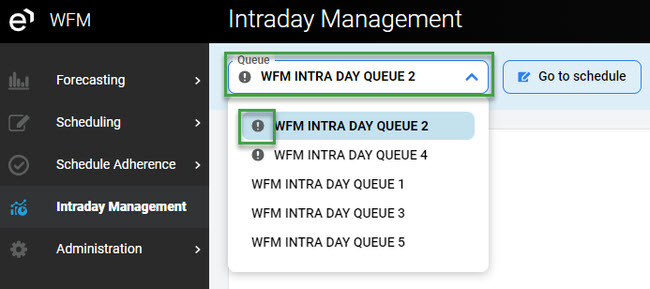
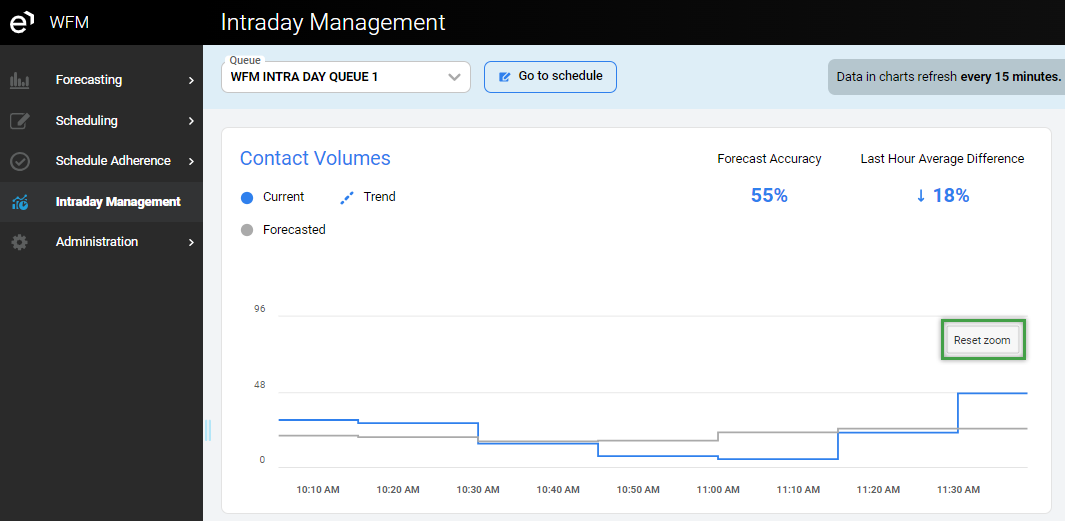
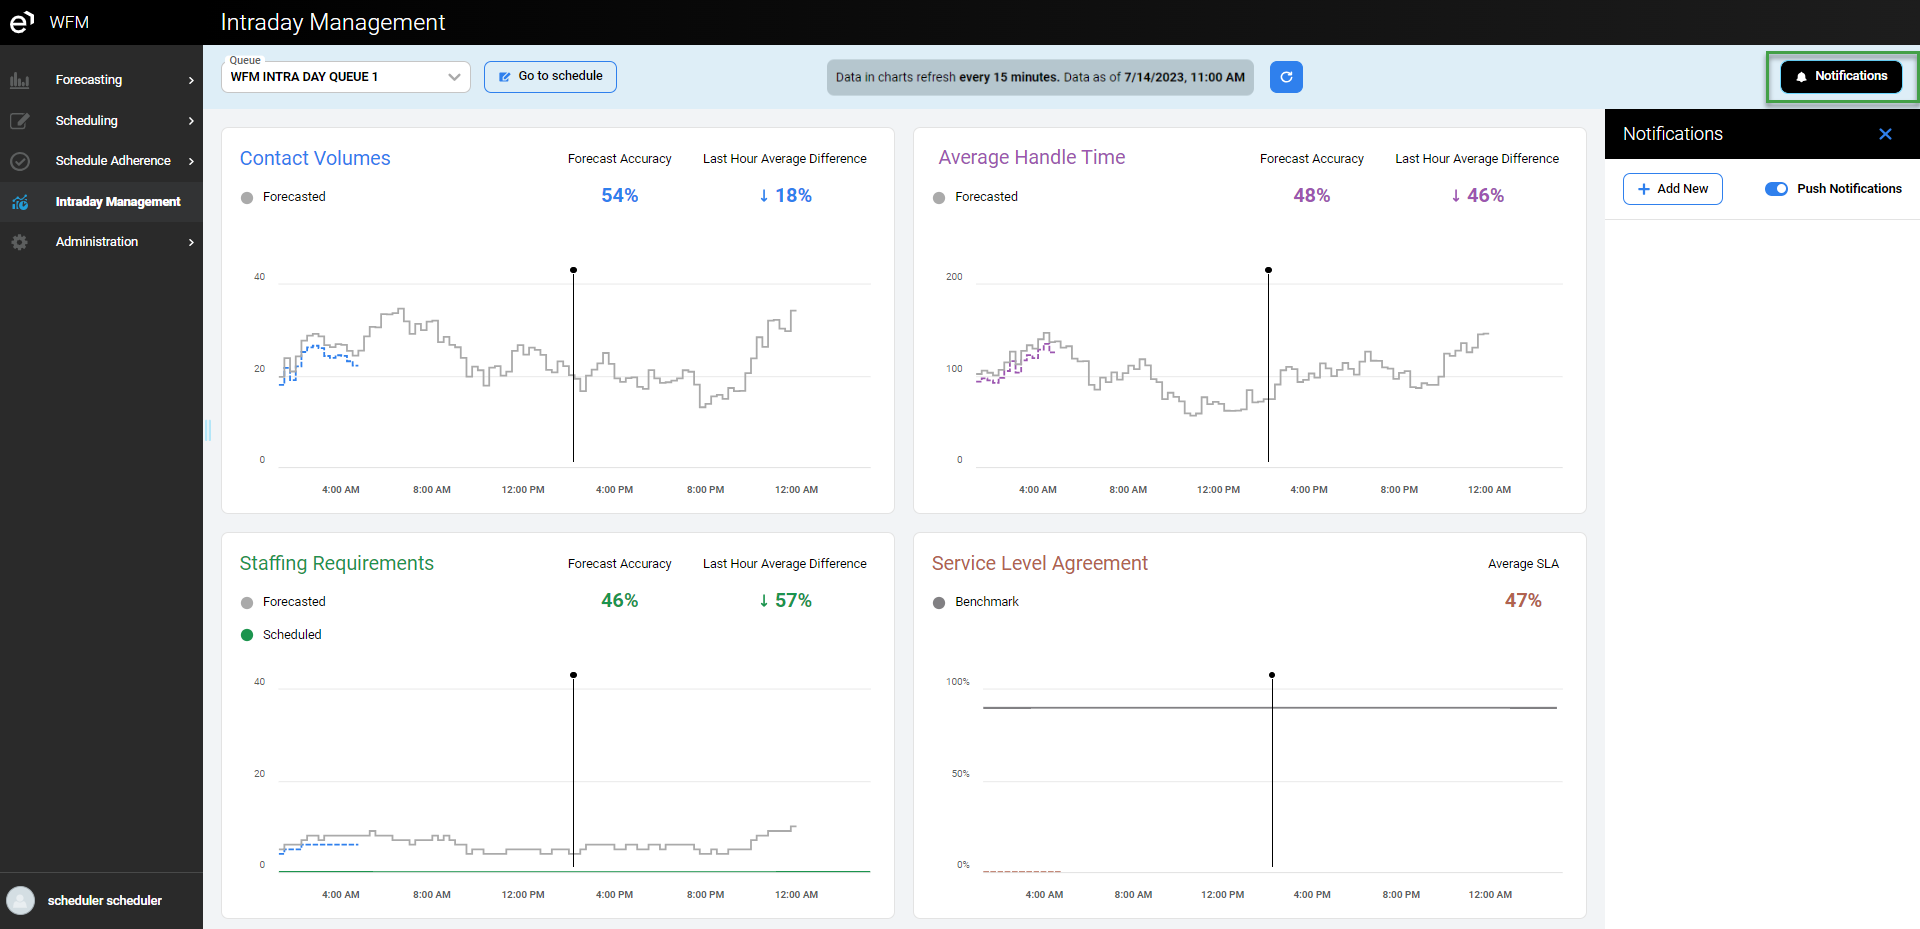
In the upper left corner, you can select the queue you want to see in the intraday management charts. The dropdown menu displays all queues for which data is available in the WFM. If an alert has been triggered for one of the queues, the icon with the exclamation mark appears next to the queue name in the drop-down menu.
Video Spot
In this video tutorial, our trainer provides some tips and tricks on how to set up a review in the Review Scheduler.
Charts Overview
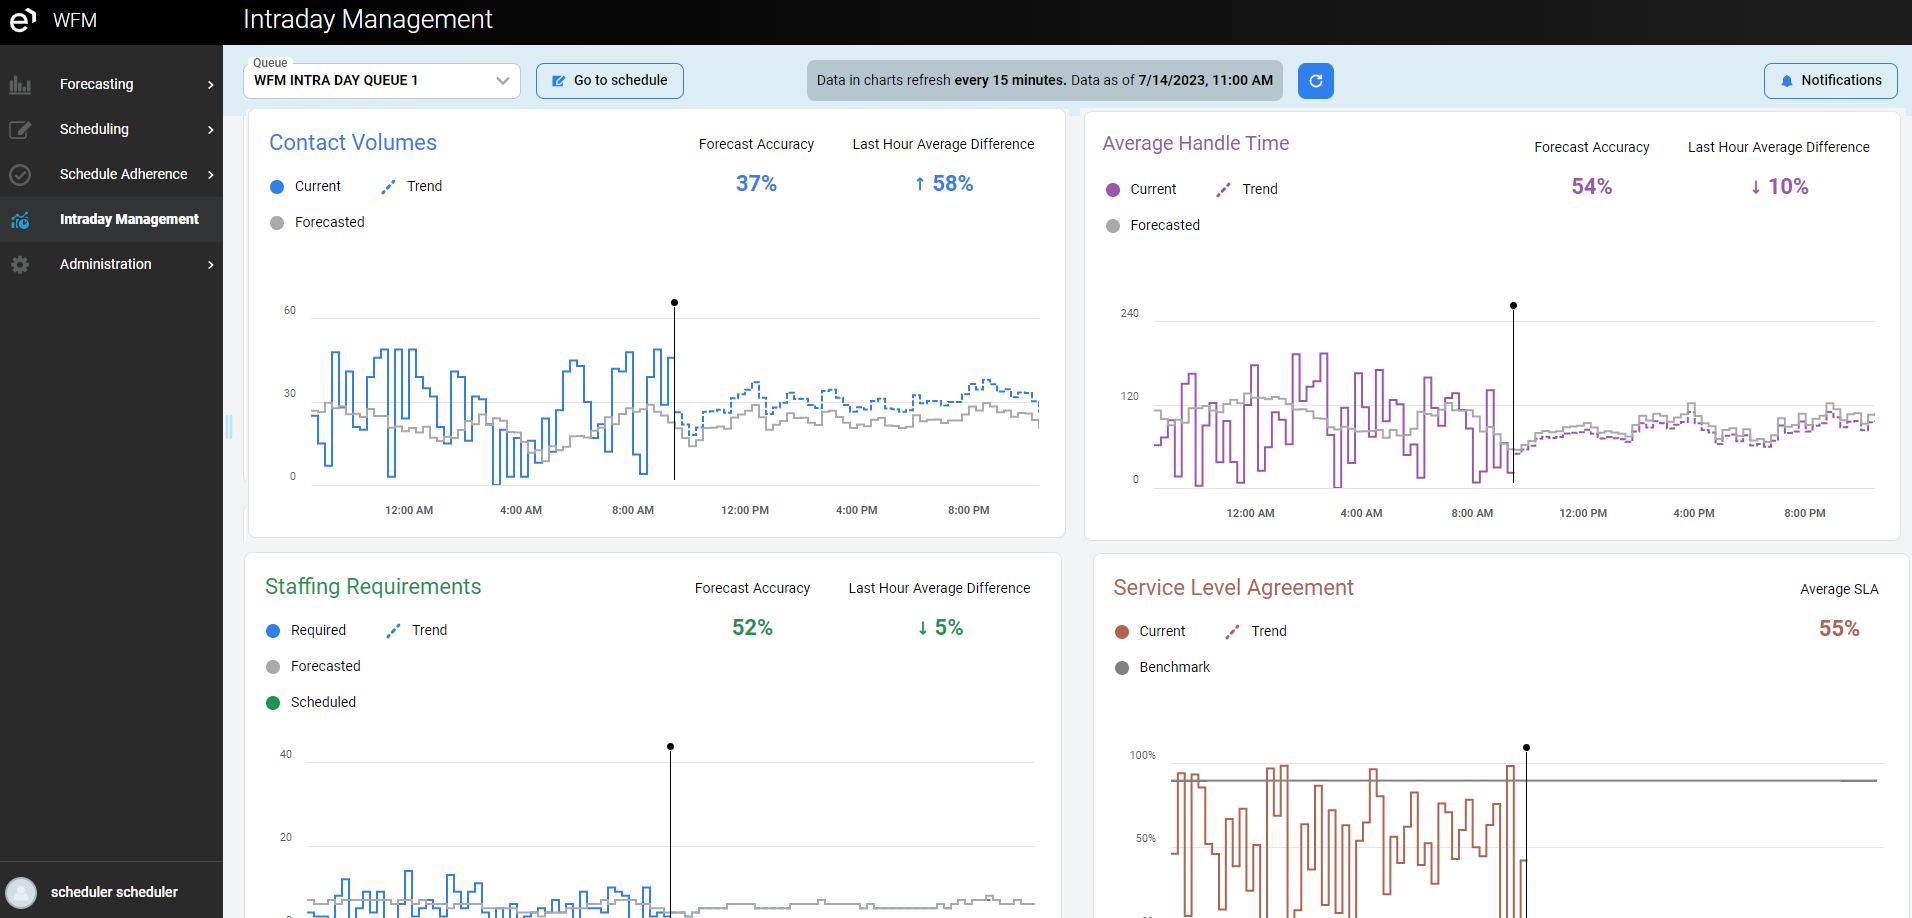
There are four charts available on the Intraday Management tab:
Contact Volumes - A metric used in call centers to measure the number of incoming calls in a given period. High call volume can impact agents' workload, affect staffing needs, and dictate call center costs.
Average Handling Time - AHT, is a customer service metric that measures the average length of a customer's call. It's a standard KPI for contact centers.
Staffing Requirement - A metric used in call centers to determine how much staff to allocate based on call volume, AHT and SLA of the given queue.
Service Level Agreement - A set of guidelines that define the customer service standards that support agents must meet during customer interactions.
Each of the diagrams displays several lines. To zoom in on any part of the diagram, select a time range using the mouse:
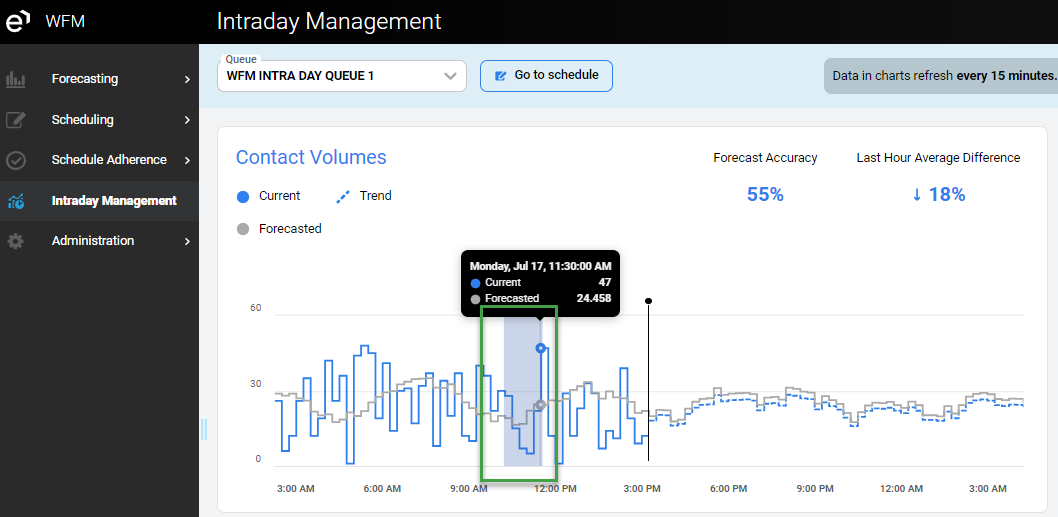
The selected time range will become focused (more detailed). To reset the view, press Reset zoom.
Data Refresh
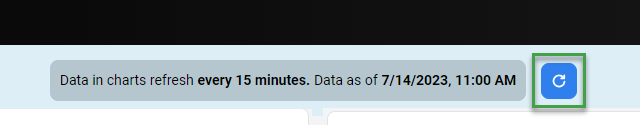
The Intraday Management tab with all charts is refreshed automatically when new data are imported, and the trend is re-calculated.
The Refresh button can be used to update charts. This is useful for cases where the page has not been refreshed for a while, or new data is received from the contact center and the charts have not been updated, or if something in the calculation failed and the page wasn't refreshed automatically. This button cannot be used to force data import earlier than scheduled (every 15 minutes).
Contact Volumes
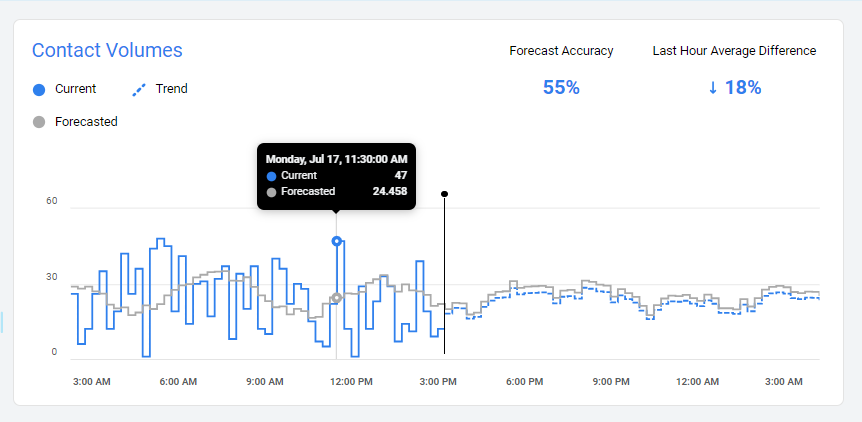
The Contact Volumes chart shows the difference between forecasted and actual contact volumes.
Forecast Accuracy - The percentage of forecast accuracy for the past 13 hours
Last Hour Average Difference - The average percentage difference between forecasted and actual volumes in the last hour
The following lines are displayed on the diagram:
Current - relevant data about contact center activity. That line displays the number of incoming calls in a given period.
Trend - trend data about contact center activity. That line displays re-forecasted contact volumes based on current contact center data.
Forecasted - forecasted data about contact center activity. A forecast is an estimate of the amount of incoming contacts that was calculated in the past in WFM.
Average Handle Time
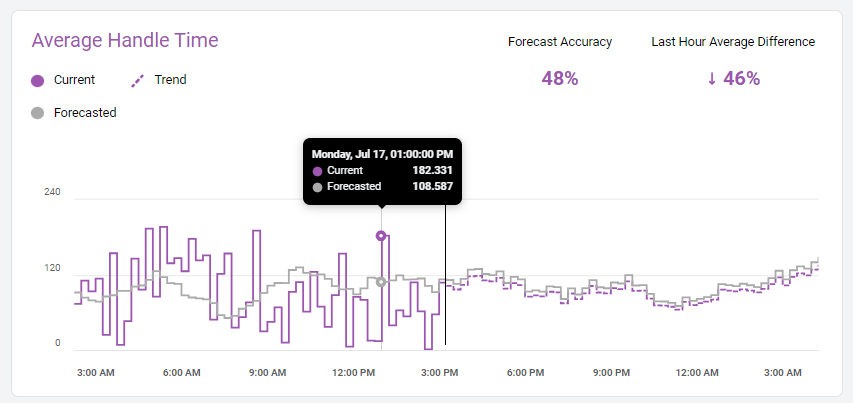
The Average Handle Time (AHT) chart shows the difference between forecasted AHT and actual AHT.
Forecast Accuracy - the percentage of forecast accuracy for the past 13 hours
Last Hour Average Difference - the average percentage difference between forecasted and actual AHT in the last hour
The following lines are displayed on the diagram:
Current - relevant data about contact center AHT. That line displays the average handle time of a customer's calls.
Trend - trend data about contact center AHT. That line displays re-forecasted AHT based on current contact center data.
Forecasted - original production forecast for AHT.
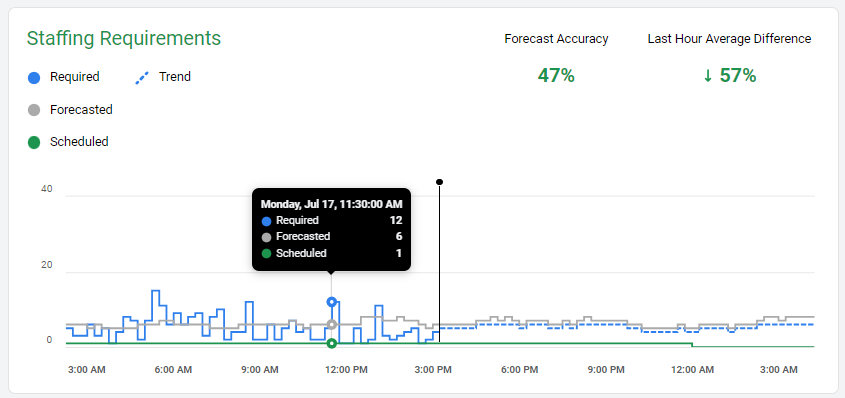
Staffing Requirement
The Staffing Requirements chart shows the difference between forecasted and actual staffing requirements.
Forecast Accuracy - The percentage of forecast accuracy for the past 13 hours
Last Hour Average Difference - The average percentage difference between forecasted and actual staffing requirements in the last hour
The following lines are displayed on the diagram:
Required Staff - Data about how much stuff is needed to cover actual contact volumes
Trend - Trend data about contact center staffing requirements. That line displays re-forecasted staffing requirements based on contact volumes and AHT trends. The staffing requirement trend is calculated without shrinkage.
Forecasted - Forecasted data about contact center staffing requirements. A forecast is an estimate of the amount of resources needed that was calculated in the past in WFM.
Scheduled - Work contribution assigned to a given queue.
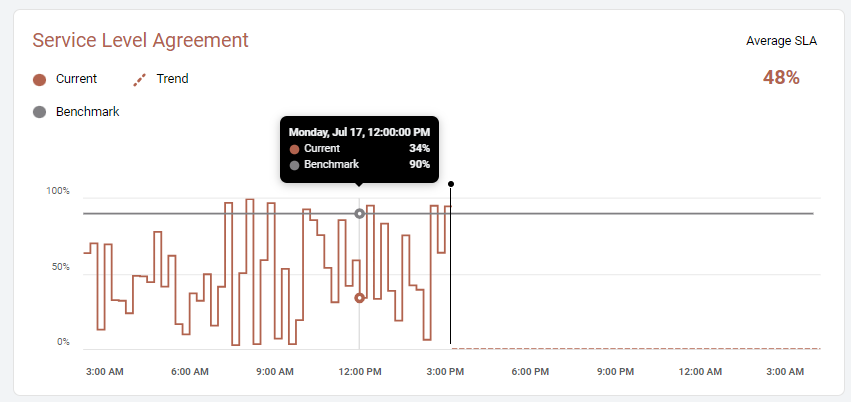
Service Level Agreement
A call center SLA is a set of guidelines that specify the customer service standards that support agents must meet during customer interactions.
Call centers determine their own SLAs. The rate at which these objectives are met is referred to as the call center service level. For example, standard objectives may include 80% of calls answered prior to 20 sec, 90% of chats accepted within 10 seconds, or 100% of emails responded to within 24 hours.
Average SLA - the percentage of average SLA for the past 13 hours
The following lines are displayed on the diagram:
Current - Current SLA imported from the contact center
Trend - Estimated service level considering trend volume, AHT, and staffing scheduled to the given queue
Benchmark - Required service level - the percentage of calls that need to be answered within a given time period (for example, 80% in 20 s means that 80% of calls need to be answered within 20 seconds). Service level can be configured for every queue separately; for details, check the documentation section Managing Queues.
Scheduling
Next to the queues drop-down menu Go to Schedule button is located.
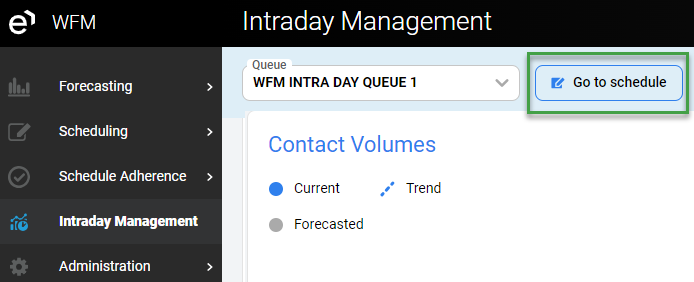
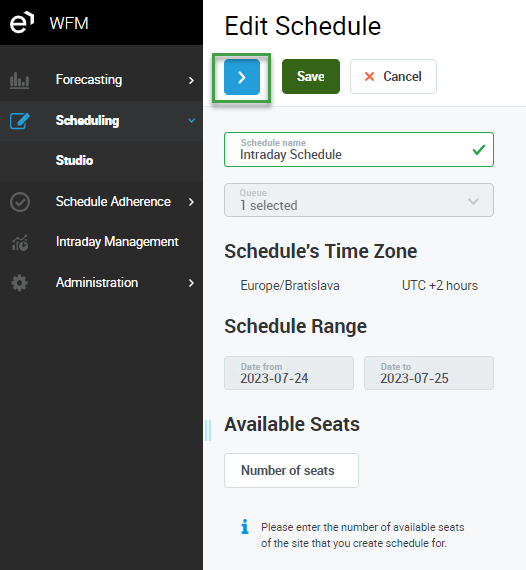
The button will redirect you to the Scheduling > Edit schedule screen.
Detailed information about working with the schedule can be found in the section Editing a Schedule.
Users can switch between the Default production forecast and the Intraday forecast. Work contribution and staffing are recalculated every time.
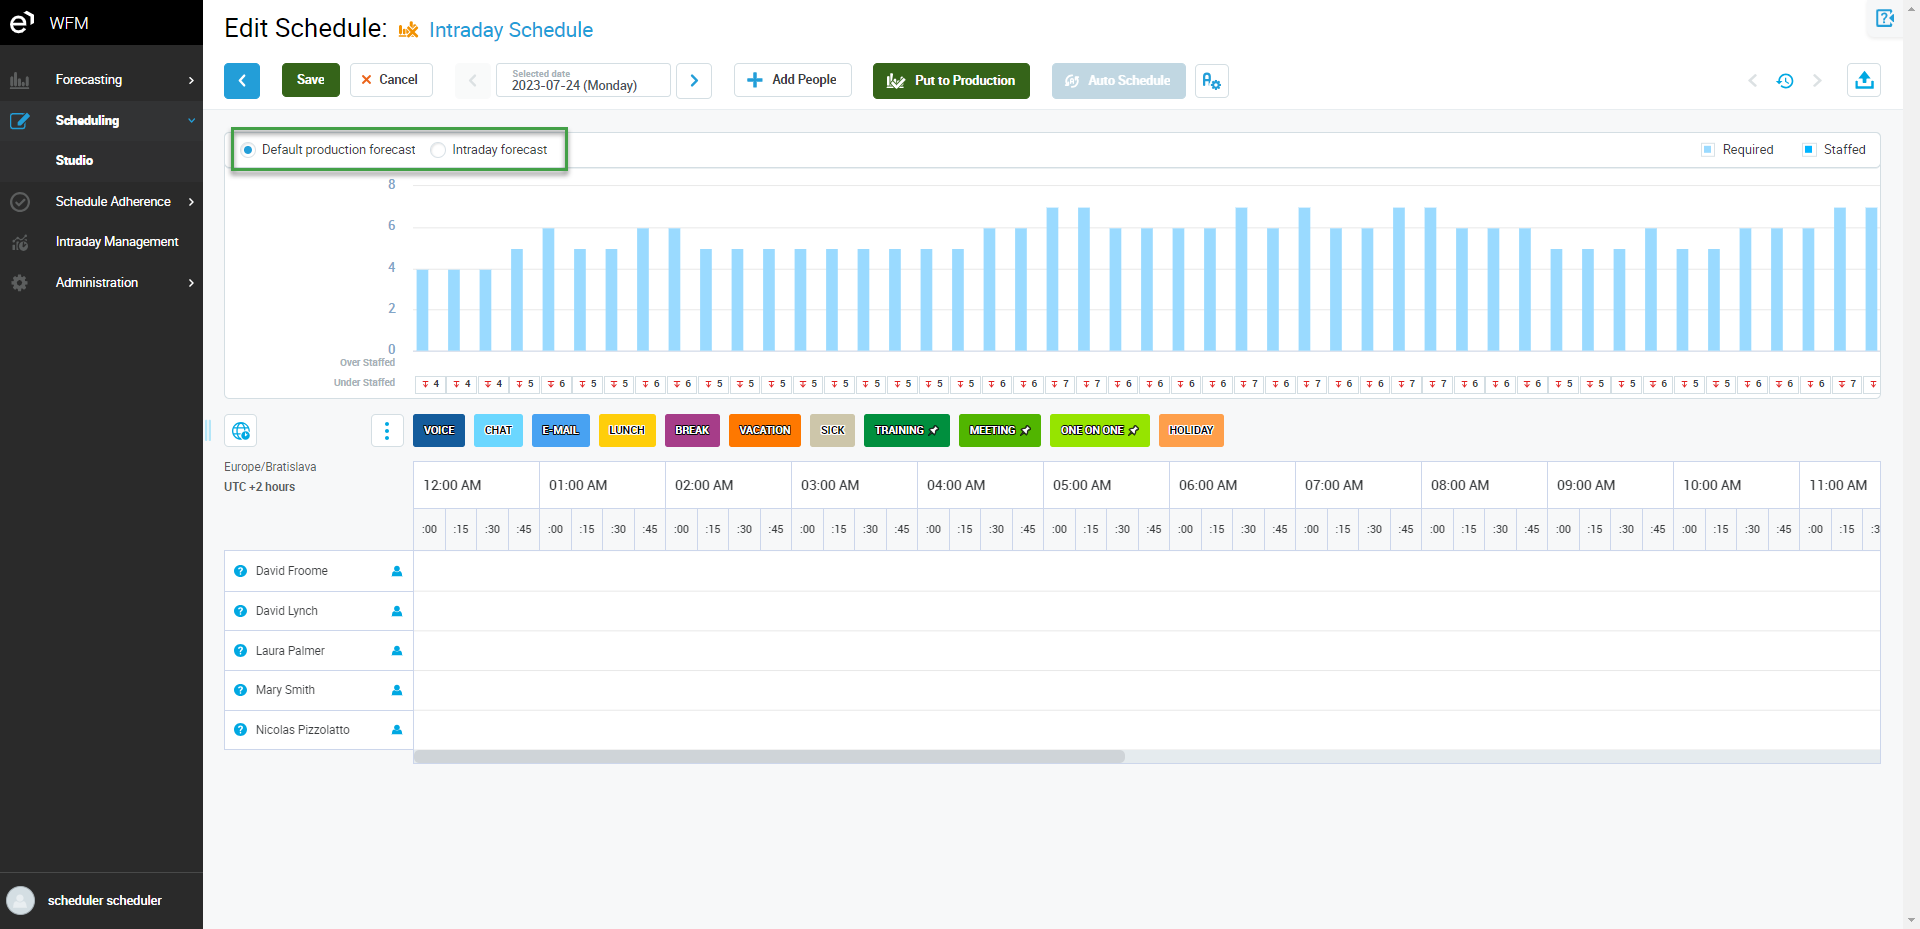
Scheduling allows automatic planning from a specific time to the end of the current day in the Intraday forecast range. The scheduling engine will generate a schedule based on the forecast that is switched on at that moment.
Notifications
INFO
The role WFM_VIEW_INTRADAY_NOTIFICATION should be assigned to see notification settings and the WFM_EDIT_INTRADAY_NOTIFICATION role should be assigned to users who edit notification settings. Read more about Roles.
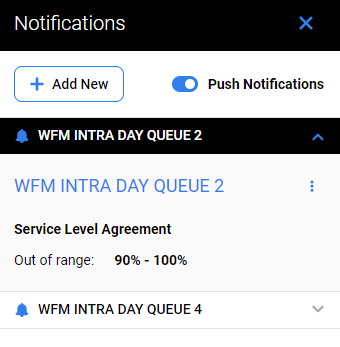
The settings for the notifications are located in the upper right corner. Press Notifications to open the tab.
Press Add New to start the configuration process.
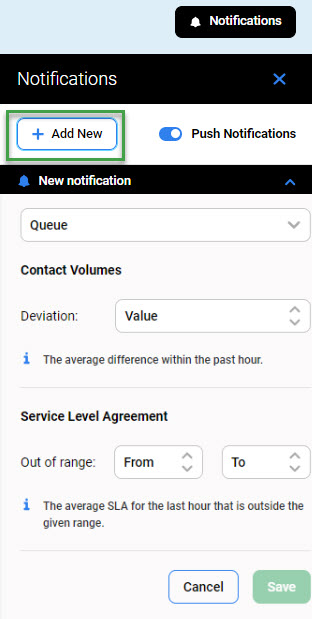
Push Notifications can be enabled for all subscribed Intraday Management users. They should be configured separately for each queue. Once push notifications are enabled, a pop-up window appears with the option to allow or block notifications for the Intraday Management module.

Queue - Select the queue from the dropdown menu that you want to be configured for notifications
Contact Volumes chart can be configured for notifications.
Deviation - Enter the value for the average difference in the past hour. If the average difference is more or less than the configured value, a notification is triggered or a push message is sent if configured.
Service Level Agreement chart can also be configured for notifications.
Out of range - Enter the values from and to. If the average SLA for the last hour is outside the given range, a notification is triggered or a push message is sent if configured.
Example: