
Dashboard
Not Supported in Cloud / Hybrid Deployments
This feature requires a dedicated license file. Users must be granted the appropriate license-based effective role in order to access the functionality provided by the dashboards. Please review the instructions on Using Eleveo Specific Roles to ensure that the appropriate license-based roles are added to Eleveo specific roles.
The visibility of certain functions is dependent on what level of access each user is granted by an administrator. Please refer to the section Access and View Permissions for a detailed overview of how License Based Roles affect the visibility of Selection Filters.
Overview
The Eleveo WFO Analytics Dashboard displays time-series comparative data for various KPIs (key performance indicators). Executives, Managers, Supervisors and Agents can view trends over time, and understand (under)performance in their center. KPIs are displayed as clickable widgets that show the KPI, a comparison of the KPIs trend against a previous time period, as well as a graphical representation of how the selected KPI has changed over time.
Limitations
Eleveo does not currently support the import of data to the Analytics Dashboard in the case of hybrid deployments.
Trends will be visible after two or more weeks of usage, if no historical data is imported.
Data Sources Displayed on the Analytics Dashboard
Eleveo imports, processes, and displays data from multiple sources. Based on your installation you may see KPIs based on data imported from one or more datasets. A detailed description of available KPIs, what they represent, and how they are calculated is provided in the list of KPIs.
Data sources currently displayed on the analytics dashboard include UCCE and UCCX. These dashboards are not supported for cloud-based deployments.
The Dashboard
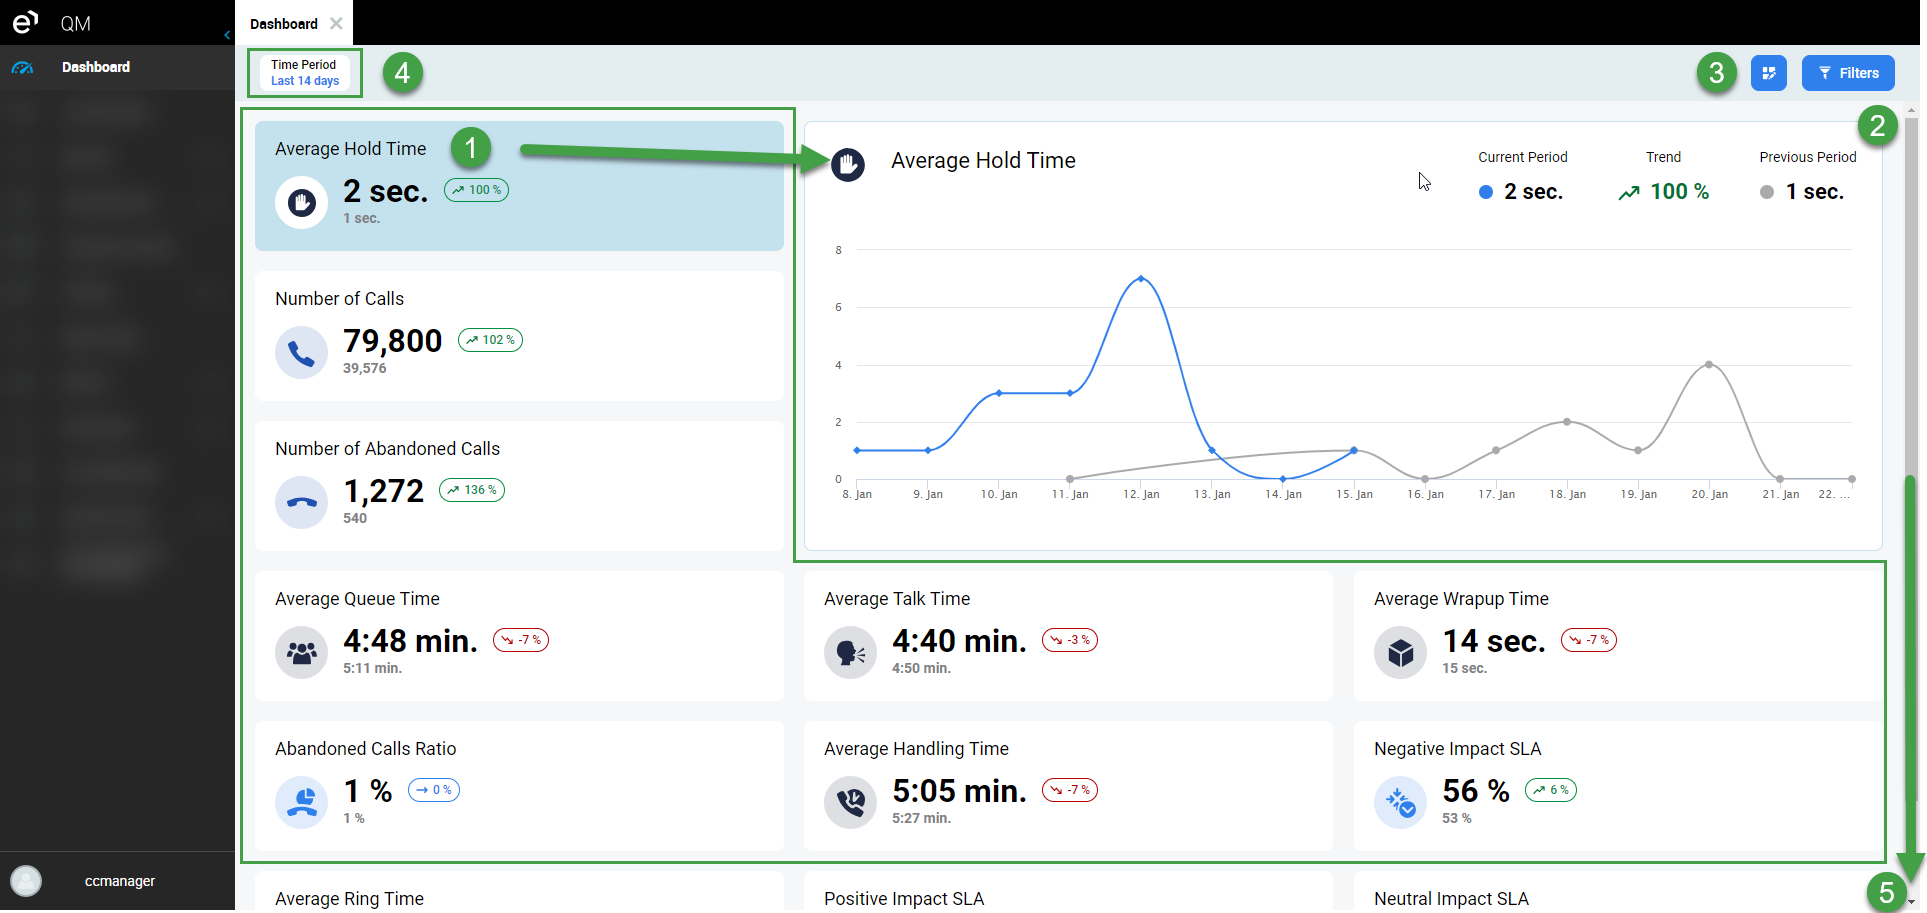
A set of predefined KPIs are visible on the Analytics Dashboard. Clicking on any metric will refresh the graph that displays the KPI performance over time, as well as a comparison against an equivalent time period preceding the current period.
KPIs display as small widgets, and contain information about the KPI, as well as a comparison of change against the previous time frame (configurable, this is set to 14 days by default).
Click on a KPI to view how the specific KPI has changed over a defined time period (14 days by default). The chart icon will be highlighted to indicate that the data is currently displayed on the graph.
A larger line graph displays how the metric has changed through time (blue line). Along with a comparison of an equivalent period of time immediately preceding the current period (grey line). The period of time displayed is equivalent to the number of days/weeks/months/years shown for the current period.Filters in the filters pane on the right side of the screen can be used to modify what data is displayed. Filters restrict the users or team(s) that are included in the visualizations.
The Edit button enables users with the correct role assignment (
ANALYTICS_ADMIN) to modify the layout of widgets.Filters currently active are displayed at the top of the screen.
Scroll to view additional KPIs.
Access and View Permissions
Not all users have access to all functionality provided on the dashboard. Access (and options available to a user) depend on the roles that are assigned to the user. For example, the role ANALYTICS_ADMIN is not granted to any user by default and must be manually assigned.
Having a particular role has the following impact on the dashboard, and modifies the filtering options available.
License-based effective role | Can view the dashboard? | Filtering options available |
|---|---|---|
| Access, view, and modify the Dashboard | All available options. User with this role must also have one of the following roles: |
| Access and view the Dashboard | Filter and view data for any Manager, Supervisor, Teams or Agent. |
| Access and view the Dashboard | Filter and view data for Supervisors, Teams, and Agents who are part of the Managers' team (refer to the Assigning Groups to Reviewers page). |
| Access and view the Dashboard | Filter and view data for Teams, Agents who are part of the Supervisors' team (refer to the Assigning Groups to Reviewers page). |
| Access and view the Dashboard, only data related to the current user is displayed. | None- Filtering options are not visible to agents. |
Filters and Filter Types
Filters affect the data displayed in the visualizations. There are two types of filters available on the Dashboard tab.
General filters – are visible to all users with one of the roles noted in the section Access and View Permissions.
Time Period
Selection filters – are not visible to all users but are displayed based on the specific role a user has (refer to the section Access and View Permissions). Adding these filters by selecting them, will immediately impact the other options available. e.g., Which agents can be selected for inclusion.
Managers
Supervisors
Teams
Agents
Filters
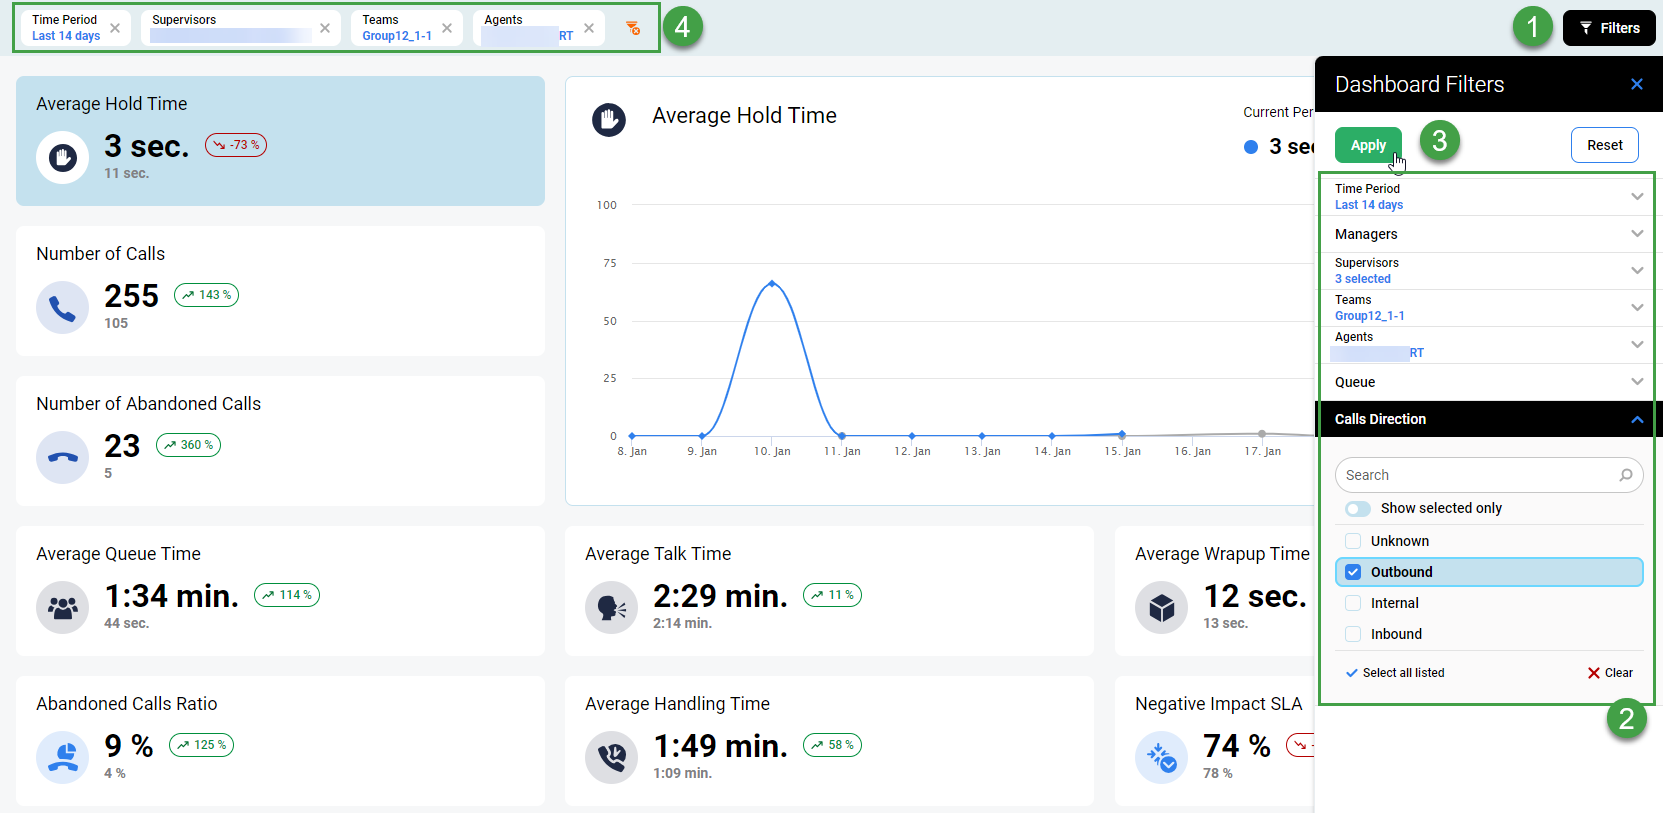
To adjust the data displayed:
Select Filters on the right-hand side, and a pane will expand.
Choose from the available dropdown menus or select the relevant boxes to restrict or extend the volume of data to be displayed.
Options available are dependent on the roles assigned to the current user:Time Period – Select a predefined time range from the dropdown list, or choose Custom Date and then enter your preferred date range.
Managers – Select from the list to view data related to their assigned Supervisors and Agents.
Supervisors – Select from the list of Agents assigned to Supervisors to view data related to their activity.
Teams – Select, or de-select, individual teams to display.
Agents– Select, or de-select, individual agents.
Queues – Select from the list of available queues to refine the data to be displayed.
Calls Direction – Further refine what data to display by selecting or de-selecting from the available options.
Click Apply.
Applied filters can be selectively removed by clicking on the x visible on the individual filter, or all can be cleared by clicking the clear filter icon. The default filters value can not be removed. If a filter does not have an option to be removed (no x) then it is a default. To modify the filter applied, open the Dashboard filters pane and modify the values there.
The options available will vary based on the role granted to the current user. Please refer to the section Access and View Permissions for details.
Modifying the Layout of Widgets
Users with the role ANALYTICS_ADMIN can customize the layout of the available widgets for each of the role types by dragging and dropping individual widgets. Changes to the default settings are saved for the next time the user logs in.
To modify the layout, and customize where widgets are on the dashboard:
Click Edit.
Select the role to be modified from the Dashboard by role dropdown.
To move widgets.
Click and drag individual widgets to an available location (they will fit an available place in the grid). It is also possible to remove a widget by clicking the x icon for an individual widget.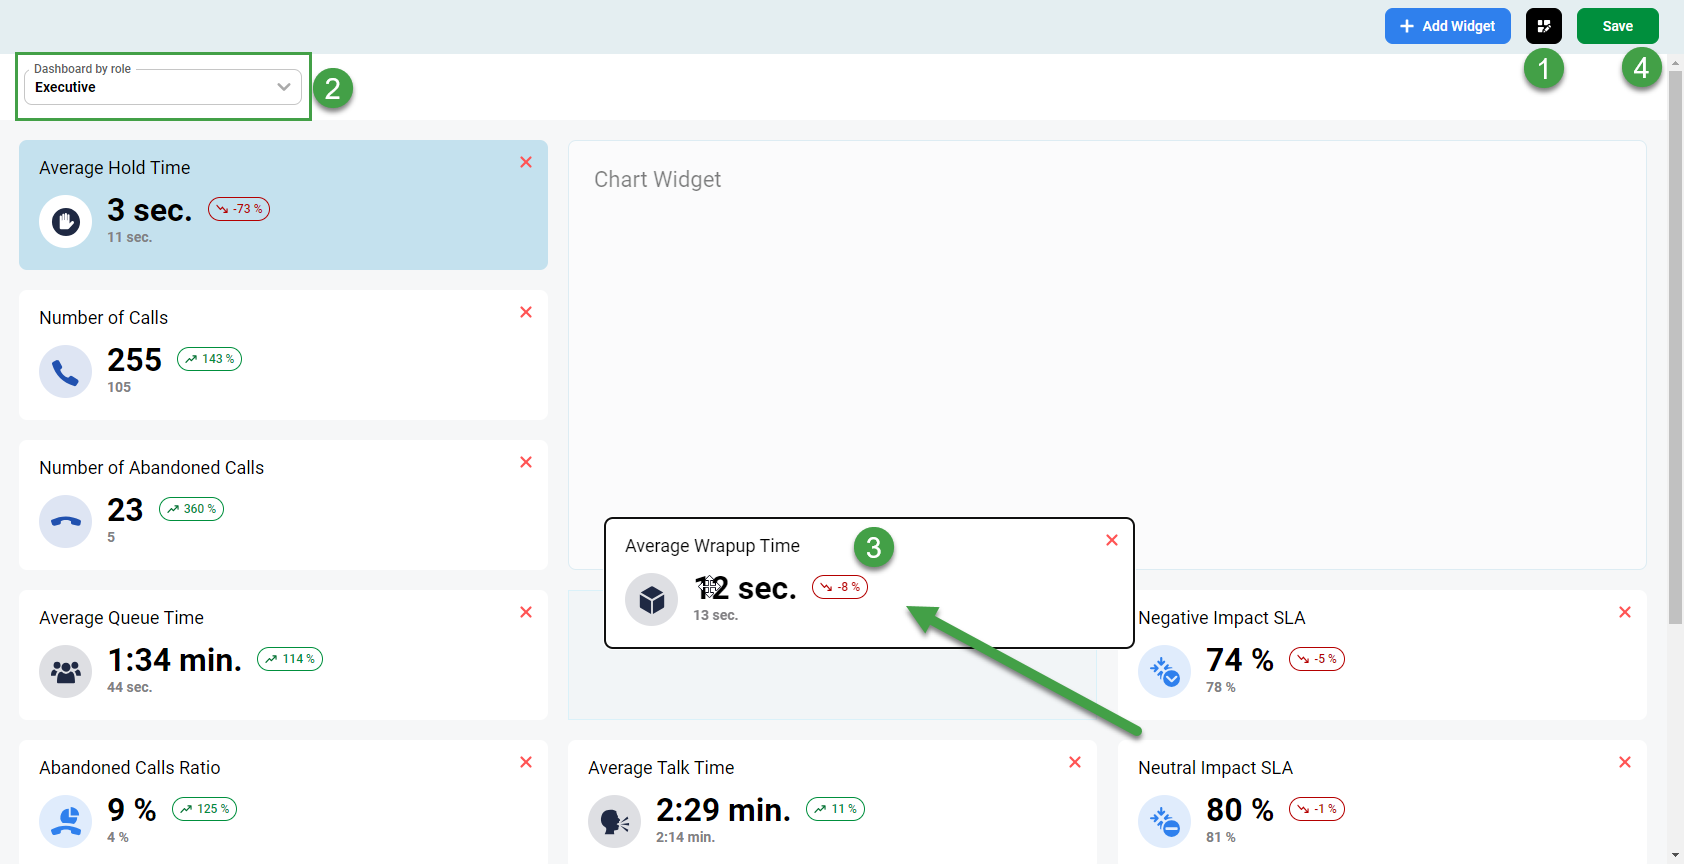
Click Save once you are satisfied with the way the widgets are arranged.
A confirmation will display to confirm that the change was saved..png?inst-v=c80cfd37-f758-42c6-830e-f5649ea1c8f6)
Select a different role to be modified from the Dashboard by role dropdown.
Make relevant changes for that role.
Click Save after making changes.
To modify what widgets are displayed to a specific role:
Click Edit.
Click Add Widget to modify the widgets visible to a specific user role.
Select the role to be modified from the Dashboard by role dropdown.
Select or Deselect items to be displayed to a specific role:
Drag and drop widgets based on your use case for the preselected role. It is also possible to remove a widget by clicking the x icon for an individual widget.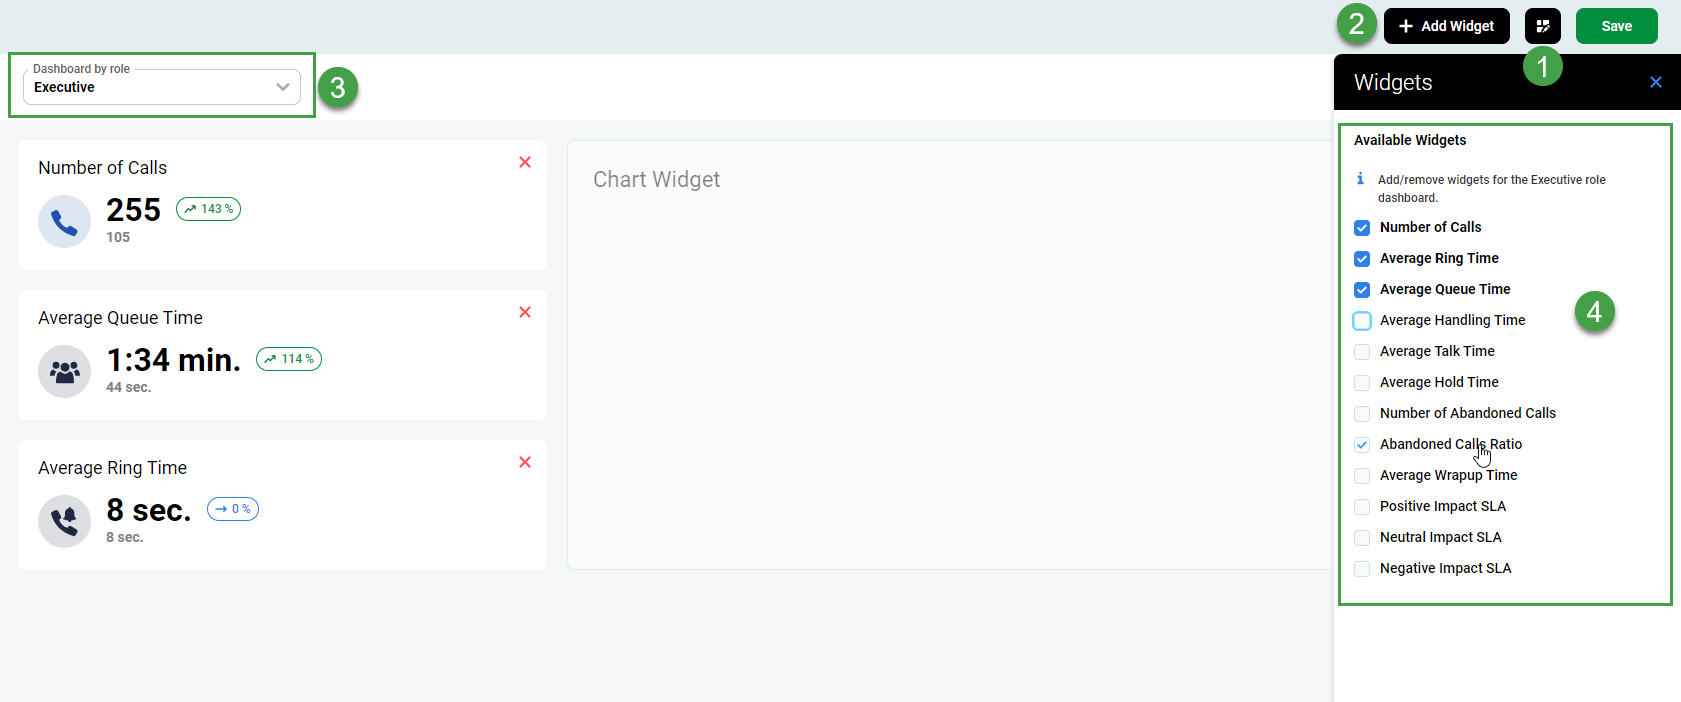
Click Save once you are satisfied with the way the widgets are arranged.
A confirmation will display to confirm that the change was saved.Select a different role to be modified from the Dashboard by role dropdown.
Make relevant changes for that role.
Click Save after making changes.
KPIs
The following table describes the KPIs pulled from external systems and how they are calculated:
Metric/KPIs displayed | Description | Calculation applied to data |
|---|---|---|
Number of Calls | Total number of calls in the call center (both handled and abandoned). |
|
Average Queue Time | Average time that callers spend waiting in a queue. |
|
Average Ring Time | Average time that the phone rings before calls are answered. |
|
Average Handling Time | Average time it takes to handle a call (consists of talk time, hold time, and wrapup time). |
|
Average Talk Time | Average time agents spend talking to customers. |
|
Average Hold Time | Average time during which calls are kept on hold. |
|
Average Wrap-up Time | Average time agents spend working on call-related tasks. |
|
Number of Abandoned Calls | Total number of abandoned calls |
|
Abandoned Calls Ratio | Ratio of abandoned calls to the total number of calls. |
|
Positive Impact SLA* | A positive formula of the SLA that takes all calls into consideration. |
|
Neutral Impact SLA* | A neutral formula of the SLA that ignores calls abandoned within the service level threshold. |
|
Negative Impact SLA* | A negative formula of the SLA treats abandoned calls as a negative. |
|
Additional information regarding SLA numbers:
The calculation of the service level agreement varies based on the data source. In general, each call is assigned information about whether it met the service level for a given queue by the reporting system (Service level is understood to be 'If the agent started handling the call within a configurable number of seconds').
For UCCX this is configured at the level of the queue. The specific attribute is called
Service Leveland can be modified by administrators on theContact Service Queue Configurationscreen within the UCCX console.For UCCE this is configured at the level of the queue. The specific attribute is called
Service Level Threshold, and can be modified by administrators within the UCCE console.
The system then sums the number of calls that met the service level value (taking into account whether they were handled/abandoned) to generate numbers that can be used in the final KPI calculations.
Please note that rounding is applied. As a result, only whole numbers are displayed, not decimals. The system uses weighted arithmetic mean.
What Information Is Displayed for Each KPI?
For each metric, the following is displayed:
Calculated value – The calculated value is based on the Adjustments applied and the KPIs available (how individual KPIs are calculated is described in the KPIs section).
Trend – The trend is a comparison of the current period against an equivalent, previous time period (for example, the 14 days preceding the current 14 days that are displayed). The following calculation is used: (
currentPeriodValue - previousPeriodValue / previousPeriodValue) * 100).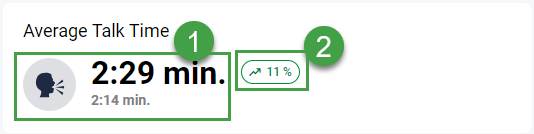
Historical Data and Changes in the System
The dashboard displays only the current state of available data. No historical changes are recorded or displayed. If an Agent or Team leader switches teams they will display as if they were always part of the current team.