Overview
The Adherence Reports feature provides comprehensive insights into agent performance and schedule alignment. Tracking key metrics related to adherence and conformance helps ensure that the workforce operates efficiently and meets operational goals:
-
Adherence – it refers to the degree to which people follow their scheduled activities in real-time. For instance, if a person is scheduled to be on shift from 10:00 to 11:00 AM but spends part of that time on break or in another activity, they are not adhering to their schedule.
-
Conformance – it measures how well people’s total work hours align with their scheduled hours over a specific period, such as a day, week, or month. Unlike adherence, which looks at specific activities during the day, conformance focuses on the overall commitment to the scheduled hours. For example, if a person is scheduled for 40 hours in a week but works only 35, their conformance would be affected.
Displaying Adherence Reports
To display the Adherence report, expand the Reports module within the navigation tree and click Adherence. The Adherence screen will display. By default, no report is generated.
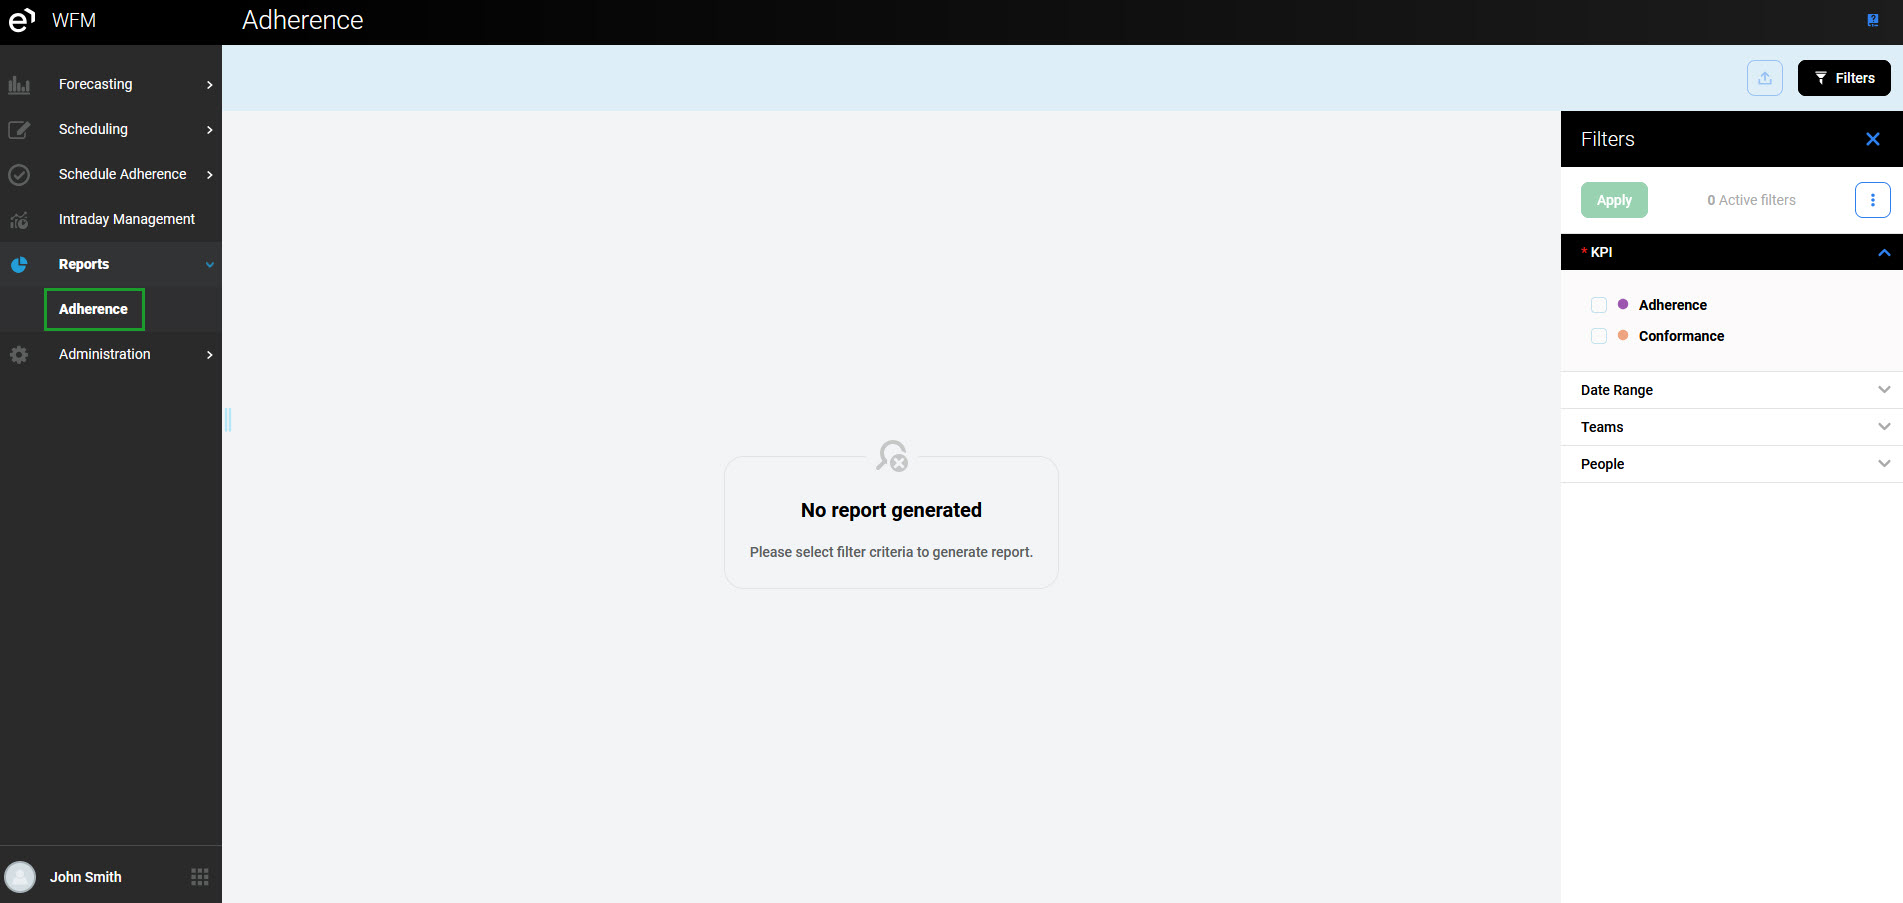
Use the Filters pane. Click the tabs to expand them and display the following filters:
-
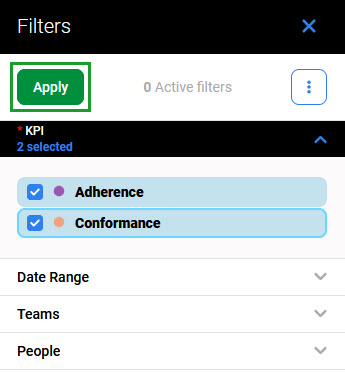
KPI – displays Adherence and/or Conformance data (this selection is mandatory to display a report)
-
Date Range – displays only data within the selected time range (if not selected, data from the last two weeks are displayed)
-
Teams – displays only data for the selected teams (if not selected, data for all teams are displayed)
-
People – displays only data for the selected people (if not selected, data for all people are displayed)
Click Apply to apply the filters and generate a report.
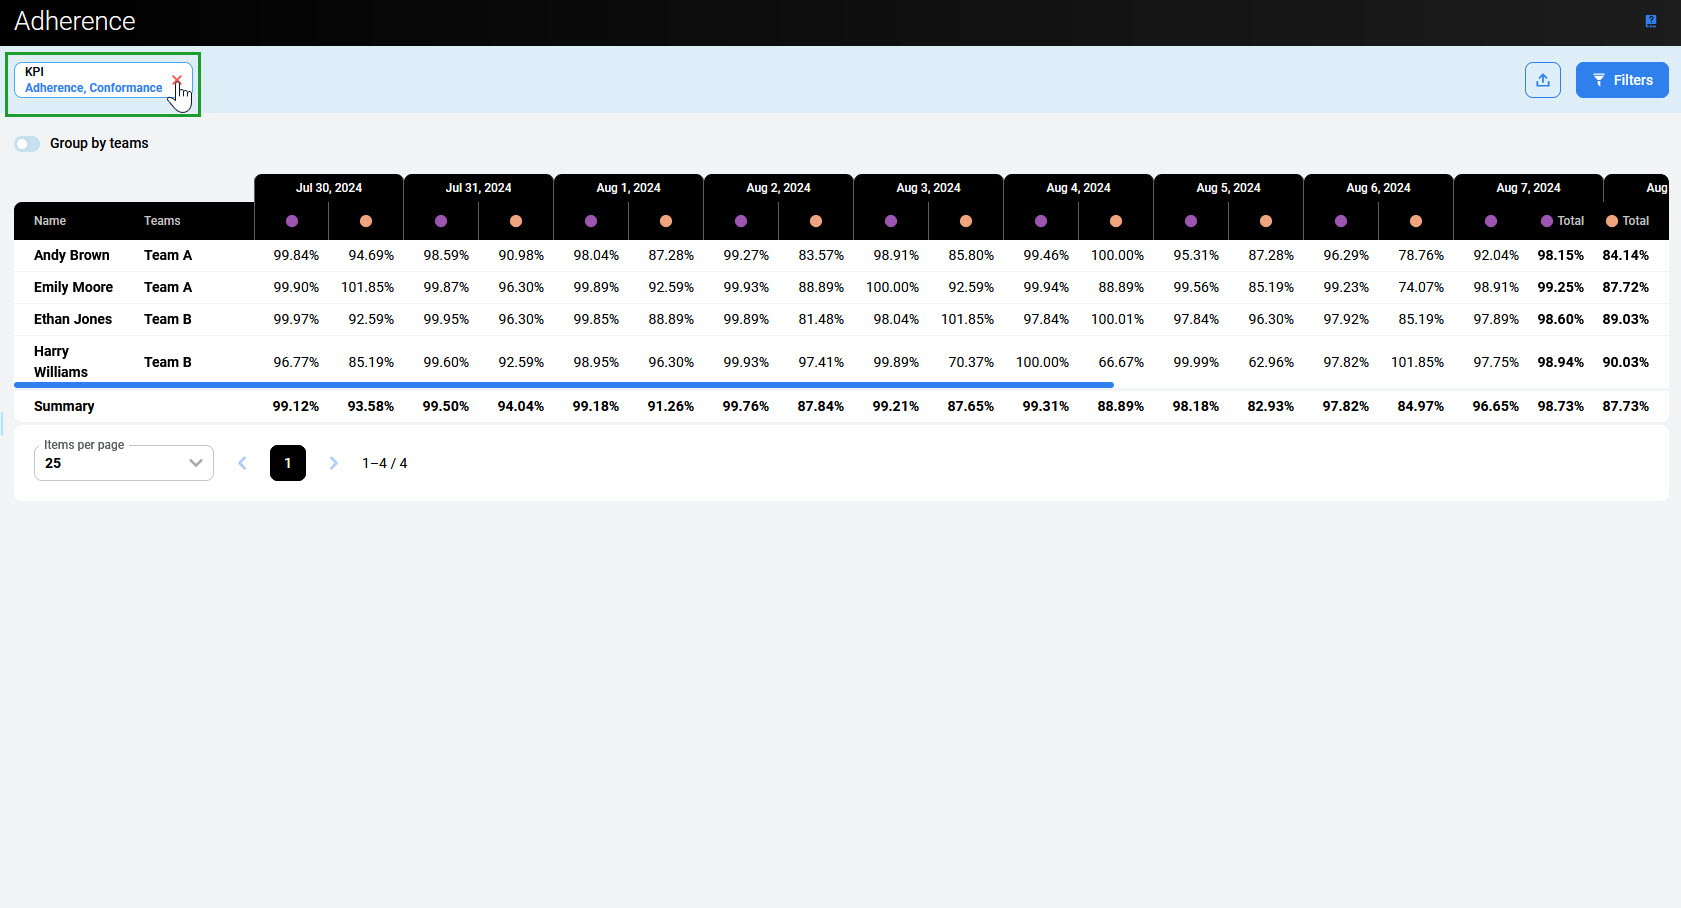
After generating a report, applied filters are listed at the top of the screen. It is possible to remove them at any time by clicking the Remove icon.
The Filters pane is hidden. To display it again, click the Filters button in the top right corner.
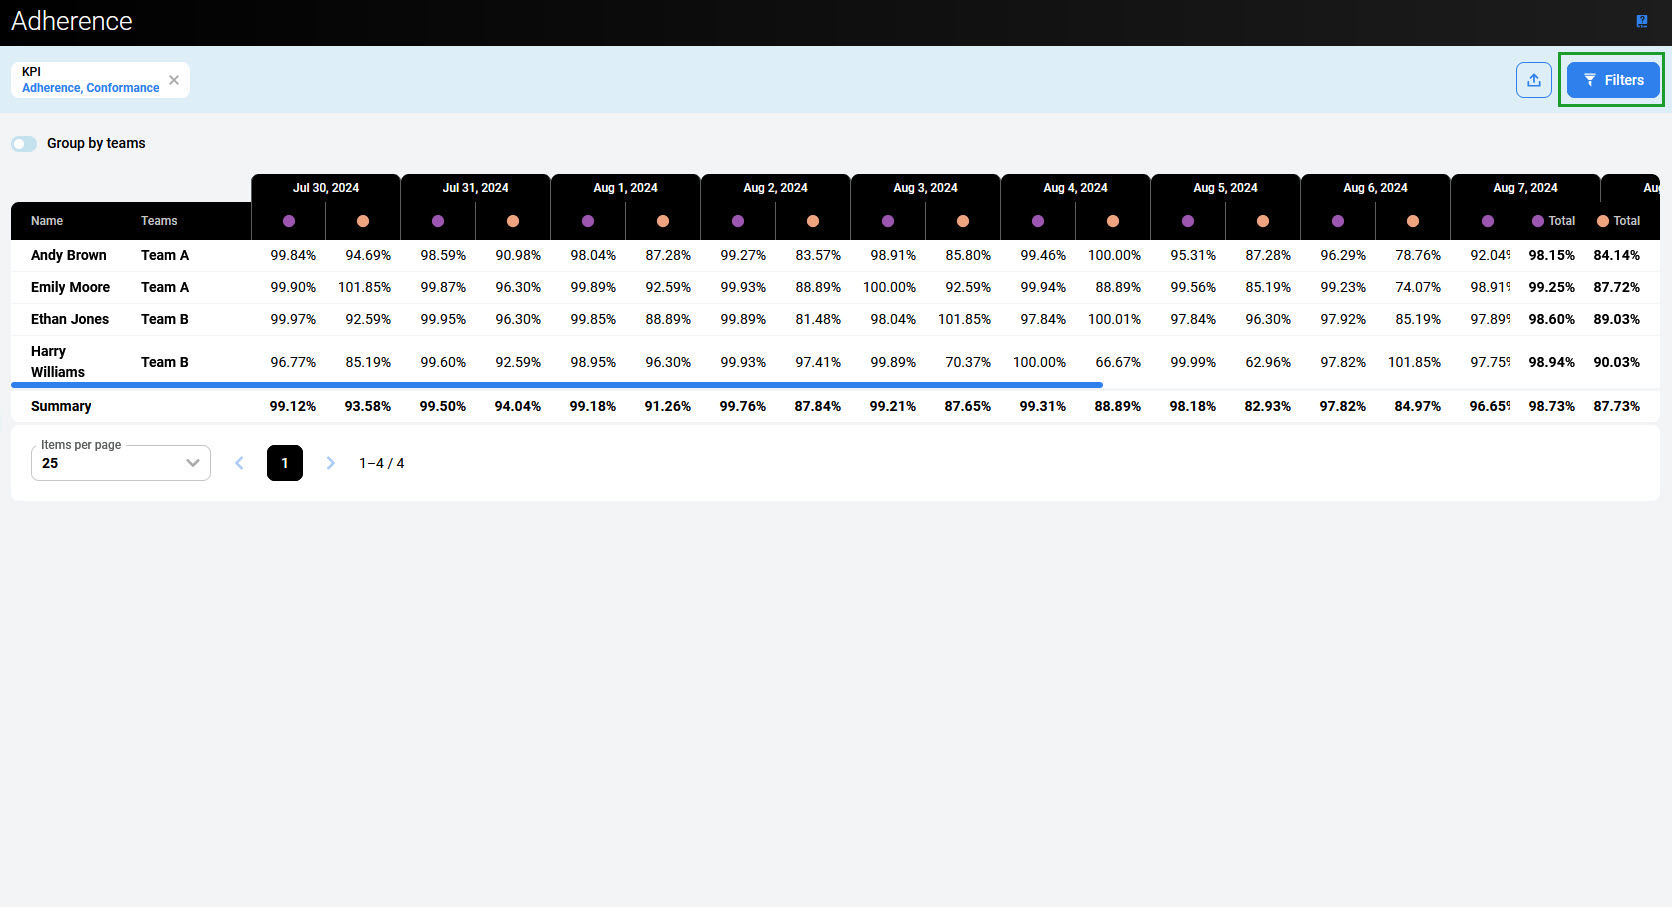
The report contains the table of the adherence and conformance values for all selected people within the selected time range:
-
Adherence (purple dot) – percentage of time when a person really worked and was scheduled to work (includes call time, after call wrap, and scheduled activities like meetings or trainings), maximum is 100%
-
Conformance (orange dot) – percentage of time when a person was scheduled to work and they actually worked, can exceed 100%.
The Summary row displays the weighted average value for the day for all people or teams.
Please note that the Summary value is calculated for all people included in the report, not only people displayed in the current page.
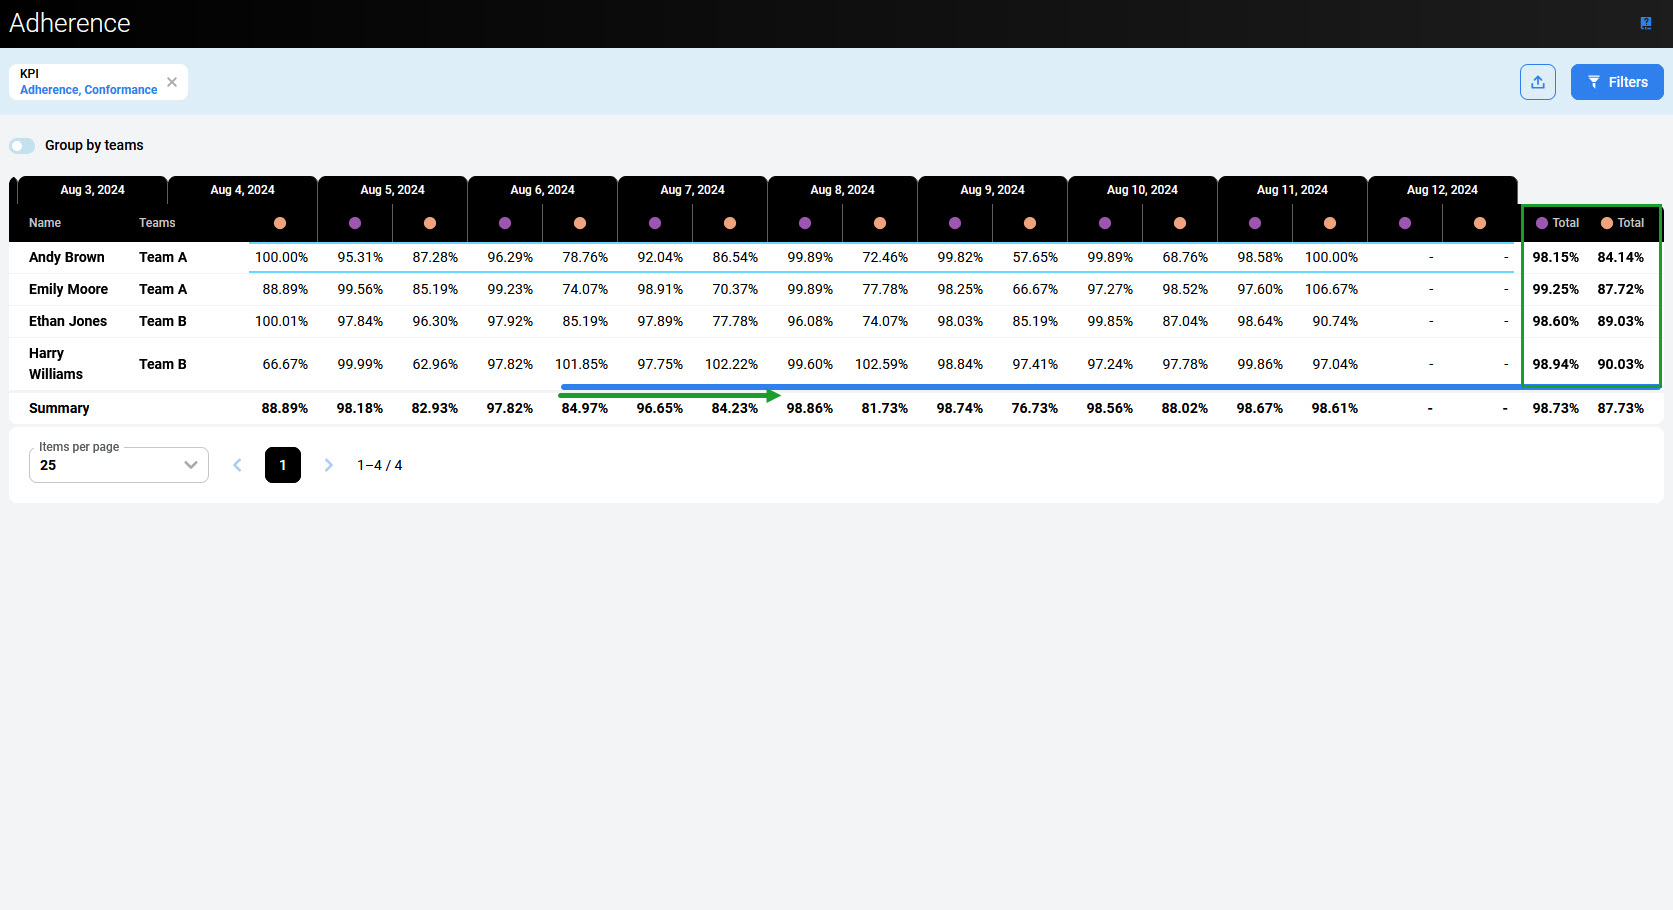
Use the scroll bar to display all days from within the selected range. The Total column at the right end of the table displays the weighted average value for each person or team, and in the last row - the weighted average of the summary values.
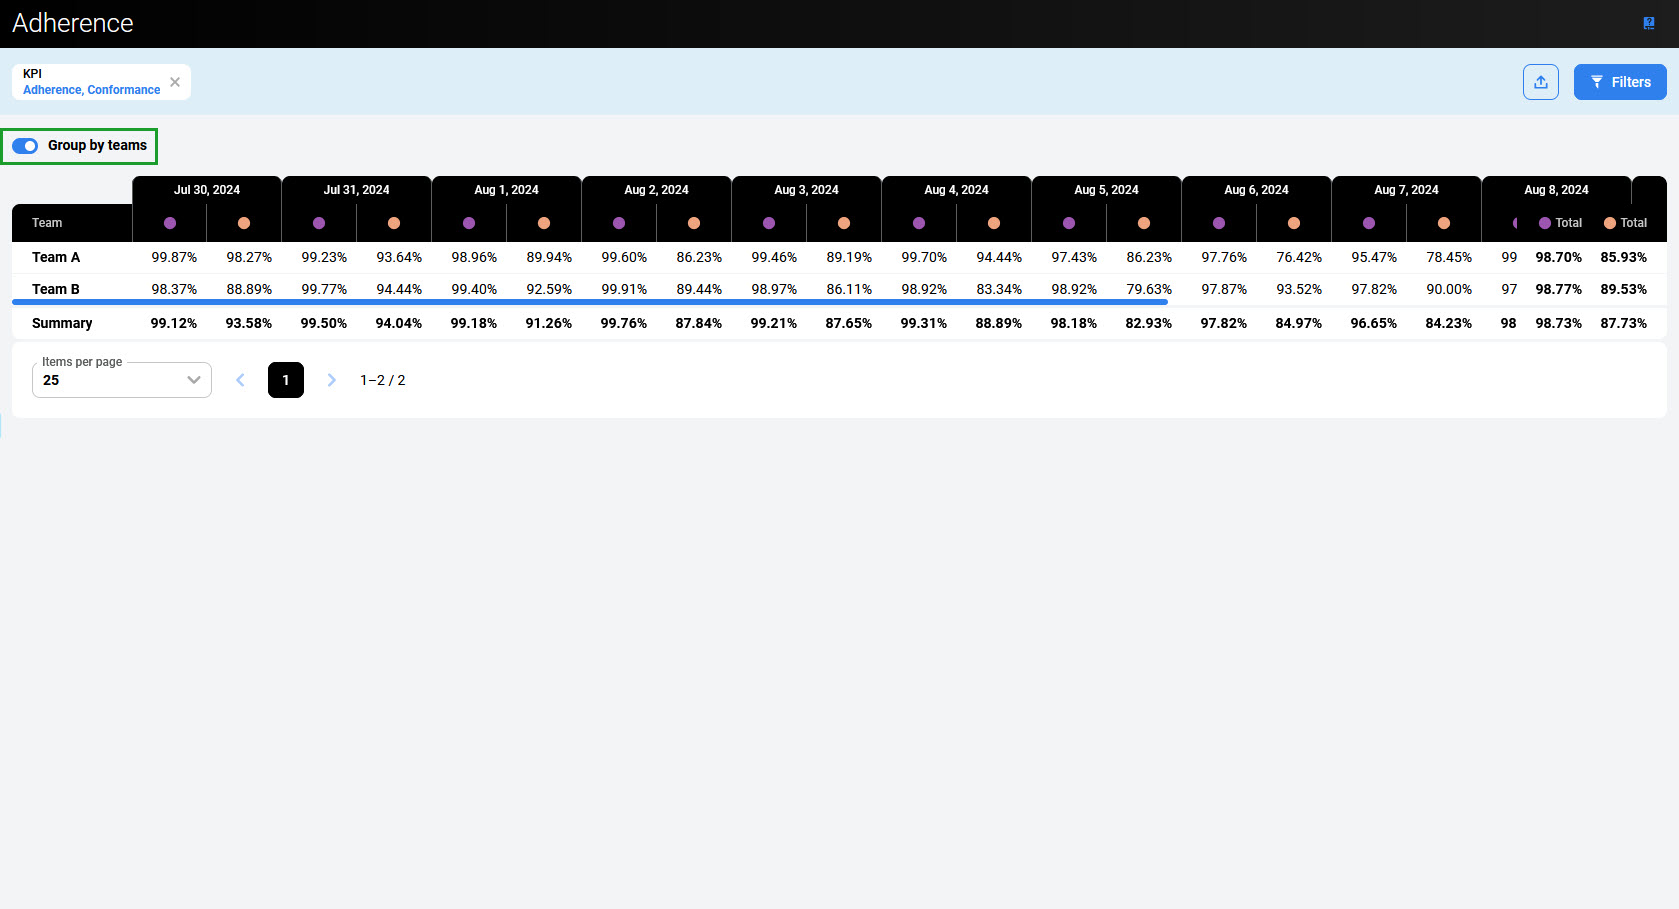
To display the results for teams, use the Group by teams switch.
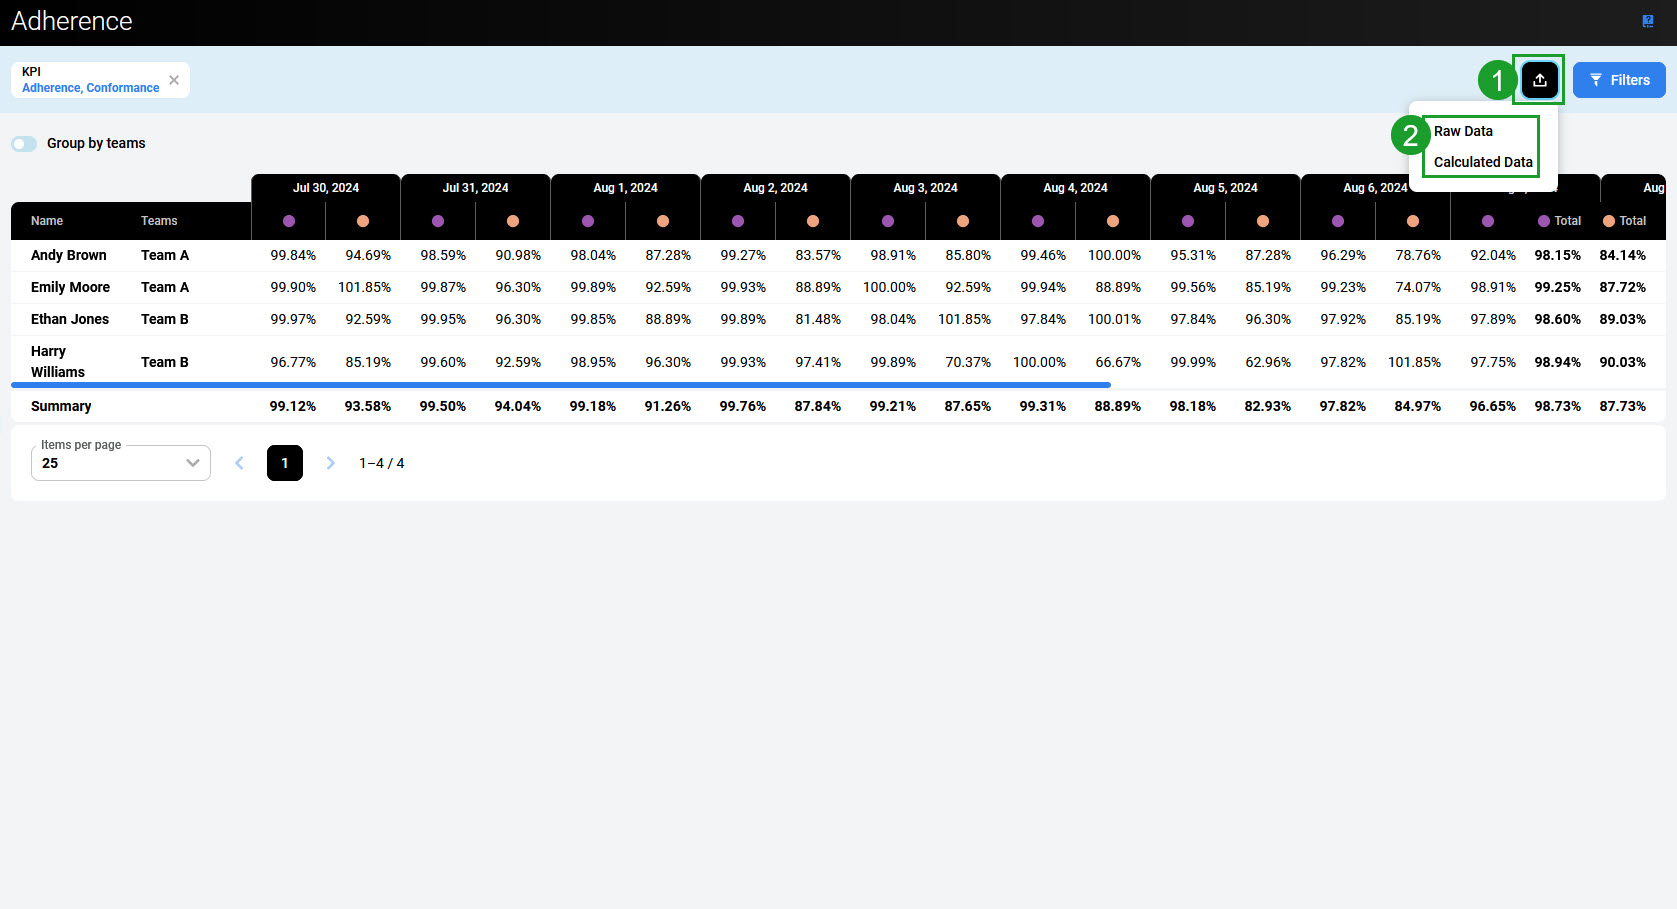
To export the report as a CSV file, click the Export button. It is possible to export:
-
Raw Data – scheduled and working times for all selected people
-
Calculated Data – calculated Adherence and Conformance values.
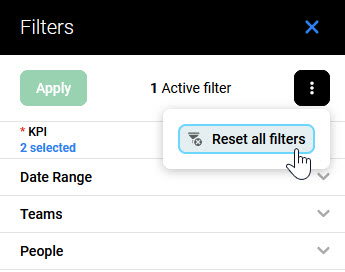
Use the Reset all filters button to reset all filtering criteria: